
Figure 4.
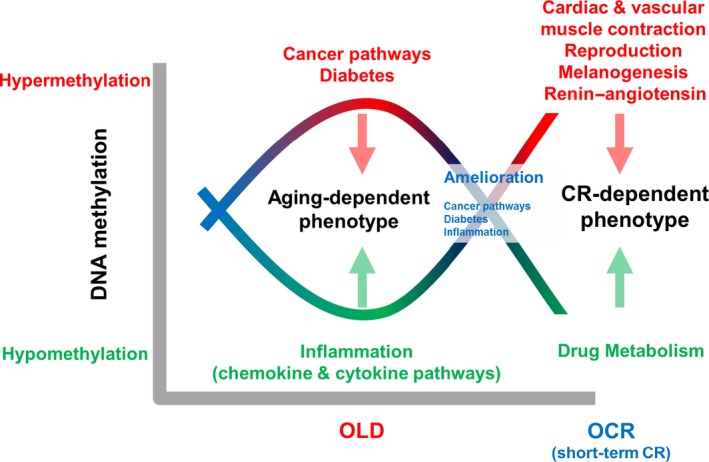
Summarized explanation of methylome changes with age and the short‐term CR effect. Hypermethylated biological processes are indicated with red letters, and hypomethylated biological processes are indicated with green letters.
Official websites use .gov
A
.gov website belongs to an official
government organization in the United States.
Secure .gov websites use HTTPS
A lock (
) or https:// means you've safely
connected to the .gov website. Share sensitive
information only on official, secure websites.
Summarized explanation of methylome changes with age and the short‐term CR effect. Hypermethylated biological processes are indicated with red letters, and hypomethylated biological processes are indicated with green letters.