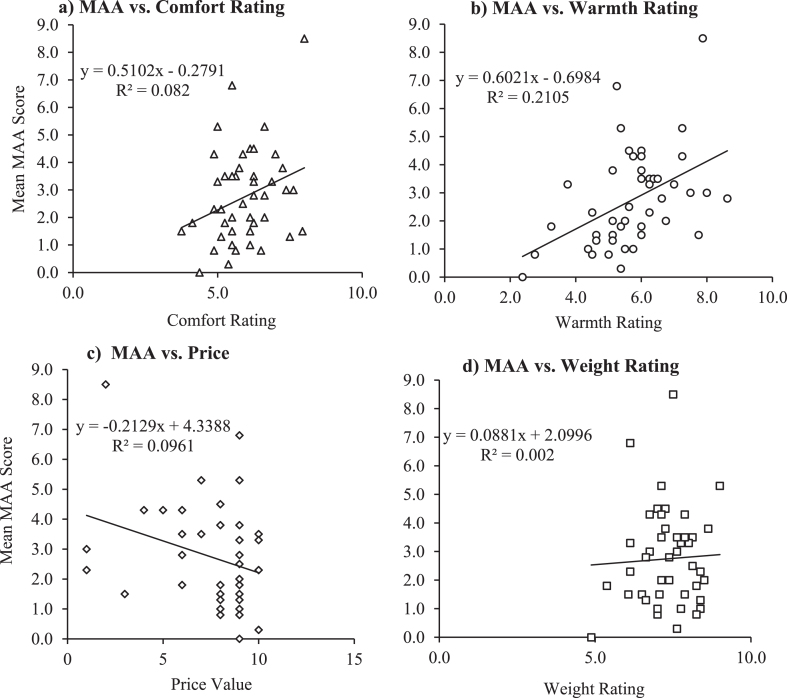
Fig.6.
Correlation graphs of MAA vs each individual factor. The lowest mean MAA amongst four mean values (mean value of uphill, downhill for both conditions separately) was recorded and plotted. The average of all the ratings/factors for all forty five types of footwear were recorded and plotted in all four graphs above, respectively.

