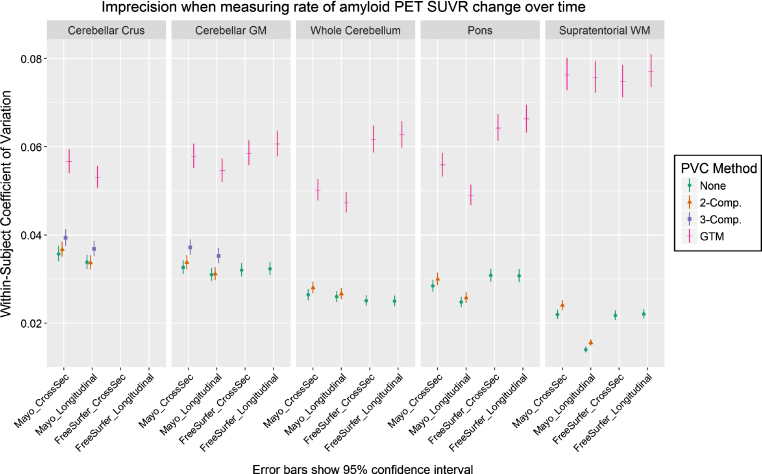
Fig.2.
Coefficient of variation (CV) in PiB PET SUVR when using each combination of measurement pipeline, PVC, and reference region. CV was estimated from a linear mixed-effects model of log-transformed SUVR values using 3 timepoints of PiB PET scans (n = 278 subjects) with corresponding MRI. CVs with GTM PVC were consistently significantly larger (worse) than when using 2-compartment PVC or no PVC.

