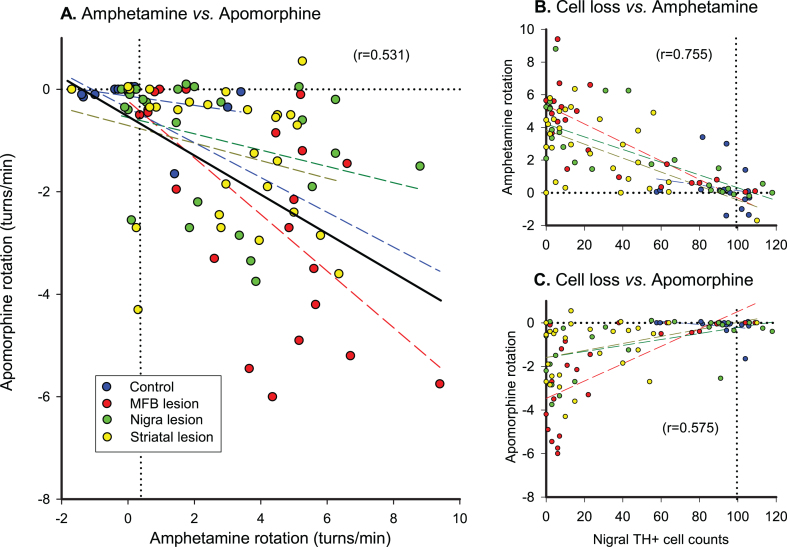
Fig.3.
Correlations between AMPH and APO turning rates in groups of control mice and mice with 6-OHDA injected into three different (striatal, MFB or nigral) targets (A). AMPH-induced turning rates correlate better with nigral TH+cell loss (B), than APO-induced turning rates (C). The ‘best fit’ regression lines were calculated by parametric analysis both for the separate groups and for all animals combined, and the Pearson correlation coefficient is shown as r2 to indicate the proportion of variance accounted for in the combined group analyses. MFB, medial forebrain bundle; TH, tyrosine hydroxylase. Unpublished data reanalyzed from the study by Heuer et al. [20], with thanks to Dr. Andreas Heuer for supply of the original data files.

