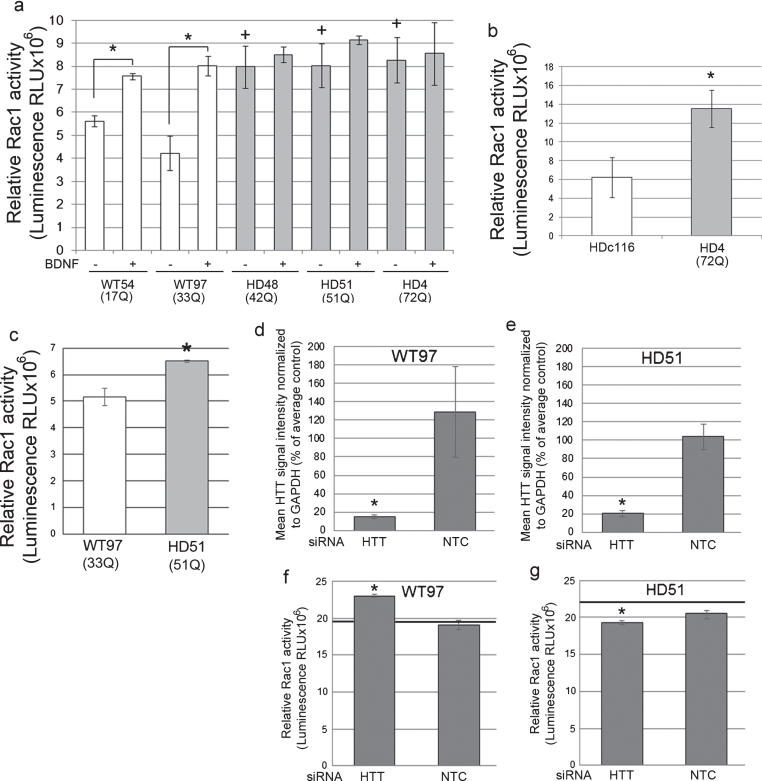
Fig.2.
Rac1 activity in human NSCs and neurons and effects of Huntingtin lowering. (a) Bar graph shows mean±SD of relative Rac1 activity (Luminescence RLUx106) for human control NSCs (WT54 and WT97) and HD NSCs (HD48, HD51, and HD4), without and with BDNF treatment. In WT cells Rac1 activity is increased with BDNF treatment as expected compared to unstimulated WT cells (ANOVA and Tukey’s HSD posthoc tests *p < 0.01; n = 3 technical replicates). In non-stimulated conditions (– BDNF), relative Rac1 activity is increased in HD NSCs compared to WT NSCs (+p < 0.01). (b) Graph shows mean±SE of relative Rac1 activity (Luminescence RLU×106) in NSCs from line HD116c (genetically corrected HD4 line) and HD4. Genetic correction significantly decreases relative Rac activity levels (*p < 0.01, n = 12 wells from 3 biological replicates, unpaired t-test). (c) Basal Rac1 activity in human HD (HD51) neurons is increased compared to WT (WT54) neurons. Graph shows mean±SD of relative Rac1 activity at DIV35 (*p < 0.05, unpaired t-test, n = 4 technical replicates). (d-g) Lowering Huntingtin increases Rac1 activity in WT neurons and reduces Rac1 activity to normal levels in HD neurons. WT97 and HD51 were treated with siRNA HTT10150 targeting HTT mRNA or with a non-targeting control (NTC) and harvested for Huntingtin detection by western blot with antibody directed to htt1–17 (Ab1) (d and e) and for Rac1 activity (f and g). Bar graphs show results for mean Huntingtin signal intensity based on pixel intensity quantification as percent of untreated control and relative Rac1 activity in siRNA HTT10150 (HTT) treated and non-targeting control (NTC) treated cells (*p < 0.05, ANOVA with Bonferroni’s Multiple Comparison test, n = 3 technical replicates). Black line in f and g shows Rac1 levels in the untreated cells measured on the same ELISA plate.

