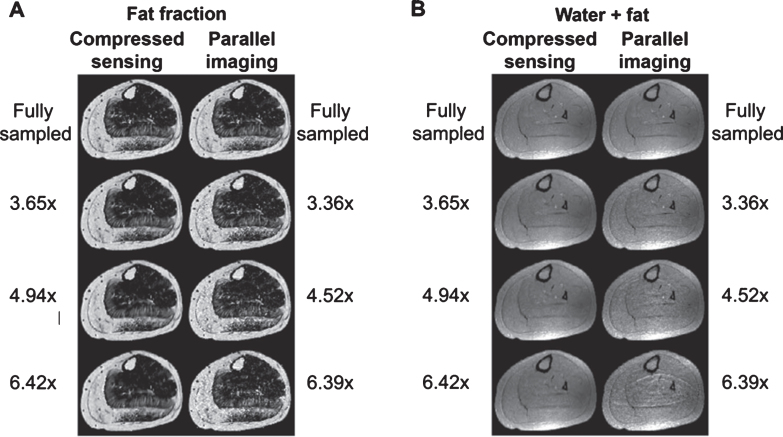
Fig.8.
Reconstructions of the left lower leg of a subject showing (A) the calculated fat fraction maps and (B) the total water and fat signal map for a fully sampled acquisition (top row) using CS and traditional parallel imaging (GRAPPA) with different undersampling ratios (subsequent rows). Figure reproduced with permission from Hollingsworth et al. [239].

