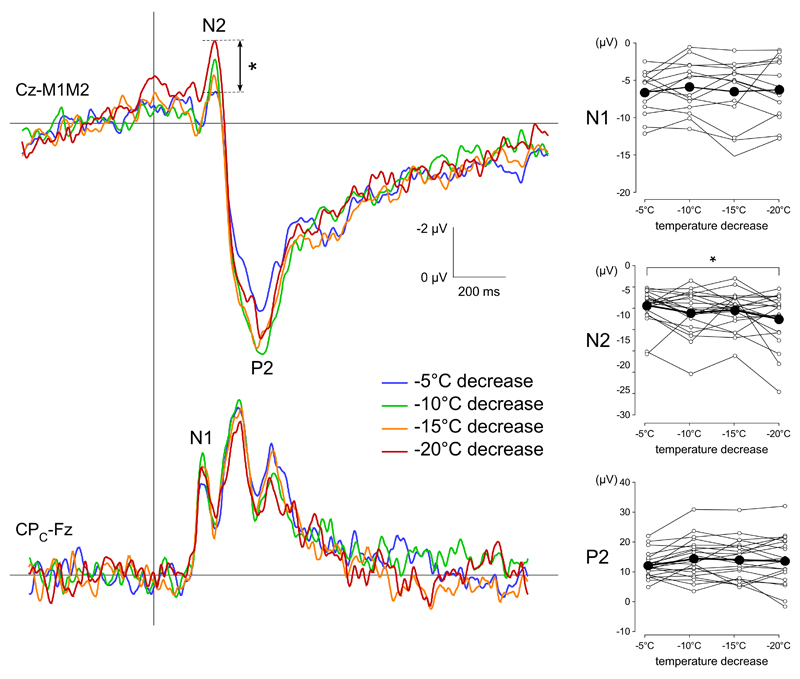
Figure 4.
Effect of the size of the temperature step on cool-evoked ERPs. The upper waveforms correspond to the group-level average CEPs recorded at Cz vs. M1M2. The lower waveforms correspond to the group-level average CEPs recorded at the contralateral centra-parietal electrode CPC vs. Fz. For temperature steps ranging between -5°C and -20°C, the amplitude of the temperature step had little effect on CEP magnitude. Nevertheless, the magnitude of the N2 wave elicited by the -20°C was significantly greater than the magnitude of the N2 wave elicited by the -5°C stimulus. The graphs shown on the right correspond to the individual (thin lines with white connectors) and group-level average (thick lines with black connectors) N1 amplitude, N2 amplitude, P2 amplitude and N2-P2 peak-to-peak amplitude. * p<.05, **p<.01,***p<.001.

