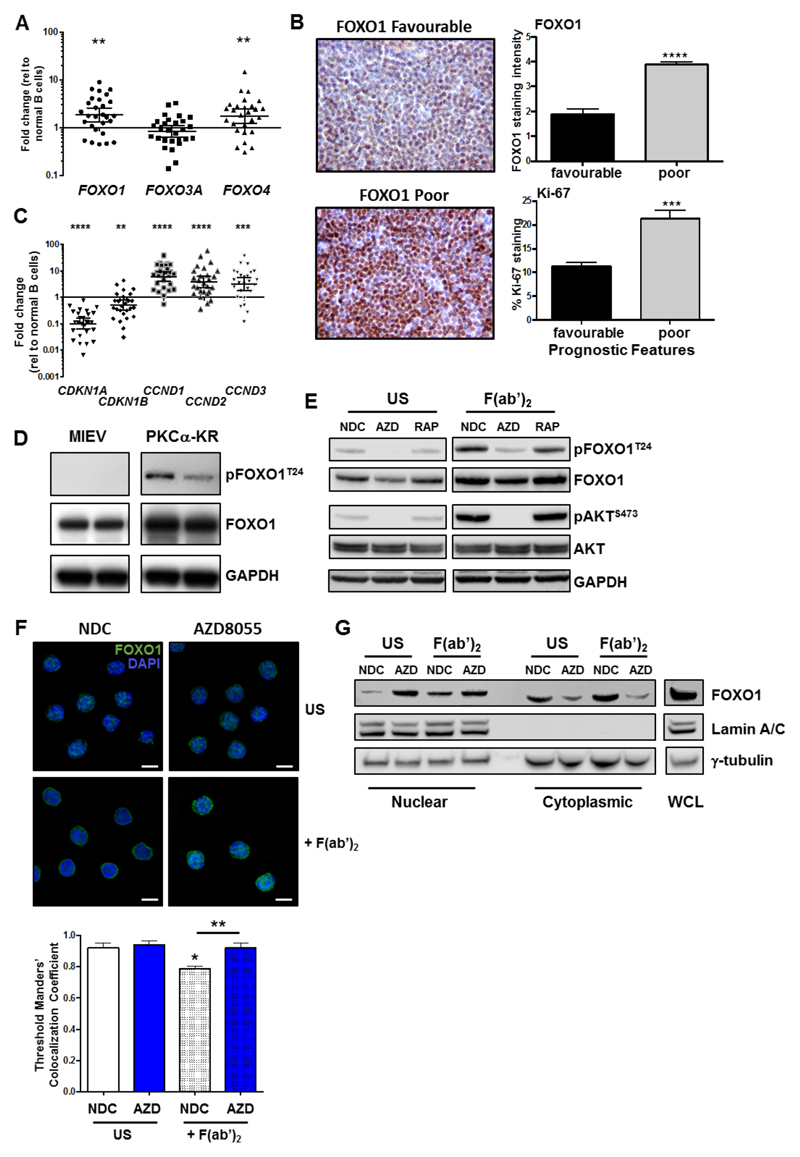
Figure 5. FOXO1 is reactivated with AZD8055 treatment upon BCR ligation.
A. RNA was isolated from fresh CLL samples (n=28) and qPCR was performed to measure expression levels of FOXO gene family members. A scatterplot of gene expression is shown, each symbol denotes an individual CLL sample. Bars indicate the mean fold change in gene expression relative to 10 healthy B cell samples ± SEM; B. IHC was performed on LN biopsies from CLL patients of favourable (n=11) and poor prognosis (n=9). Representative images are shown for FOXO1 staining. FOXO1 and Ki-67 stained LN sections were scored and compared between favourable and poor prognostic CLL samples; C. qPCR (from A; n=28) was performed to measure expression levels of FOXO target genes as indicated. Bars indicate the mean fold change in gene expression relative to 10 healthy samples ± SEM; D. Protein lysates were generated from in vitro co-cultures of MIEV- or PKCα-KR-transduced mouse cell cultures. Western blotting compared the phosphorylated and expression levels of FOXO1T24 and total FOXO1 respectively, compared with loading control GAPDH. E-G. CLL cells were pre-treated with 100 nM AZD8055, 10 nM rapamycin, or left untreated (NDC) as indicated. BCR was ligated with addition of F(ab’)2 fragments for 1 h or US. E. Western blotting assessed phosphorylated levels of FOXO1T24 and AKTS473 and expression levels of total FOXO1 and AKT. GAPDH is included as a loading control; F. CLL cells were fixed and permeabilized and stained with anti-FOXO1 Ab (green) and DAPI (blue). Top: A representative 100x deconvoluted image of primary CLL cells is shown (n=3); Scale bar, 5 µm. Bottom: Analyses of the IF images (x40) were performed in CellProfiler to quantify colocalisation of FOXO1 fluorescent intensity levels with DAPI (nuclear stain) in individual cells from individual CLL patients. The average Threshold Manders’ Colocalisation Coefficient for each condition from 3 individual CLL patient samples is shown. G. MEC-1 cells were pre-treated for 30 min with 100 nM AZD8055 (AZD) or left untreated (NDC) as indicated and then BCR was ligated for 1 or left US. Thereafter nuclear and cytoplasmic fractions were prepared and immunoblotted alongside whole cell lysates (WCL). Western blotting shows the levels of FOXO1, lamin A/C (nuclear) and γ-tubulin (cytoplasmic) proteins in each condition. Representative blot shown of n=3 biological replicates.

