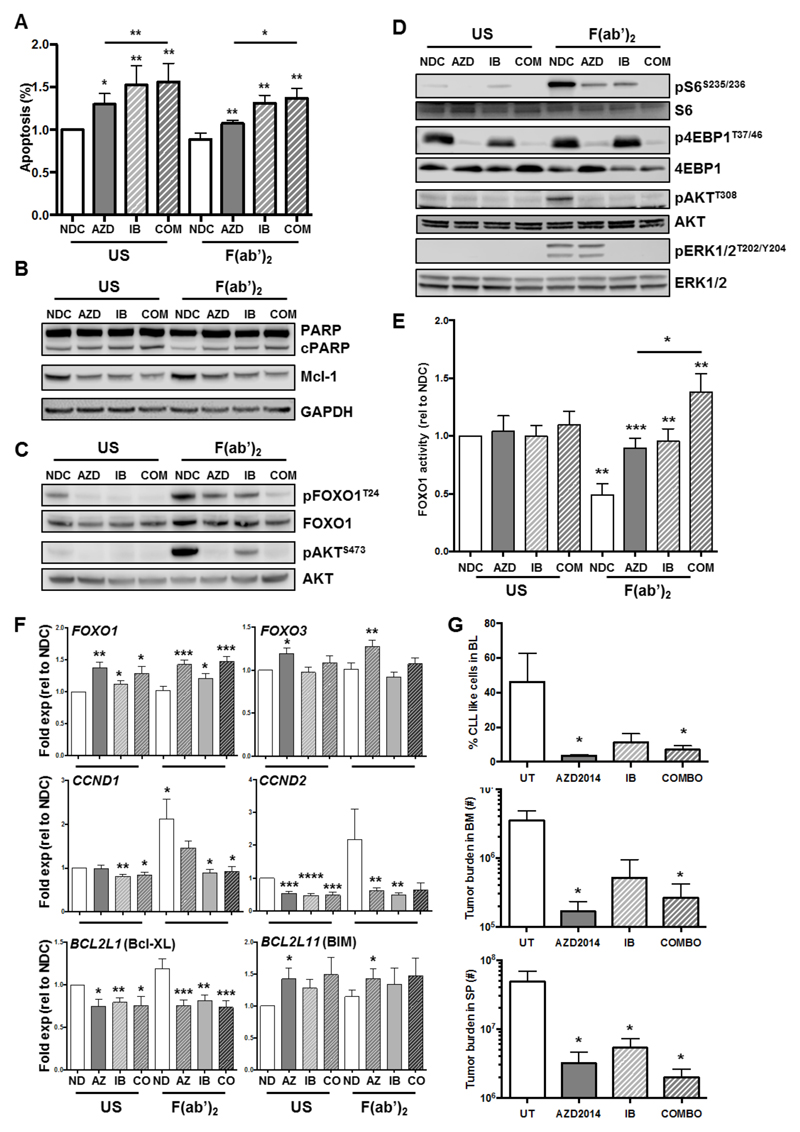
Figure 6. Combination of AZD8055 with Ibrutinib further increases FOXO1 function upon BCR ligation in primary CLL cells.
CLL cells were pre-treated for 30 min with 100 nM AZD8055 (AZD) or 1 μM ibrutinib (IB) alone or in combination, or left untreated (NDC) as indicated and then BCR was ligated with addition of F(ab’)2 fragments for 1, 24 or 48 h or left US, as indicated. A. Cell viability was analyzed by flow cytometry after 48 h incubation (n=7). p value generated by a paired two tailed t test; B. Western blotting was performed to determine the level of PARP cleavage and Mcl-1 expression after 48 h incubation (n=4). GAPDH is included as a loading control; C&D. Western blotting was performed to determine the phosphorylated levels of FOXO1T24/FOXO1 (C), AKTS473/AKT (C), S6S235/236/S6 (D), 4EBP1T37/45/4EBP1 (D), AKTT308/AKT (D) and pERK1/2T202/Y204/ERK1/2 (D) (n≥4); E. Nuclear lysates were generated from CLL cells and DNA binding activity of FOXO1 was assessed in each condition, as indicated (n=5). Statistical significance calculated using a student’s t test; F. RNA was prepared from CLL cells (n≥8 individual patient samples) treated with AZD8055 (AZ) or ibrutinib (IB) alone or together (CO) in the presence or absence of BCR ligation after 24 h incubation as indicated, and mRNA expression levels of FOXO1, FOXO3, CCND1-2, BCL2L1, and BCL2L11 were determined by qPCR. Each gene is expressed relative to GUSB reference gene and calibrated to ND US or ND F(ab’)2 samples. Data are mean ± SEM, and p values generated by a paired two-tailed t-test. G. After confirmation of a population of CLL-like cells in the blood, mice were dosed daily with 15 mg/kg AZD2014 (OG), 12 mg/kg ibrutinib (OG) alone or in combination, or respective vehicle control for up to 14 days. Thereafter, blood, BM and spleen were analyzed for leukemic burden. The average percentage of GFP+ CLL-like cells in the blood is shown for each treatment arm (top); Cell number of GFP+ CD45+CD19+ population is shown in treated mice in the BM (middle) and SP (bottom). All data shown are the mean (± SEM) of 5 individual mice. p values were generated using the student’s unpaired t-test.

