
Fig. 2.
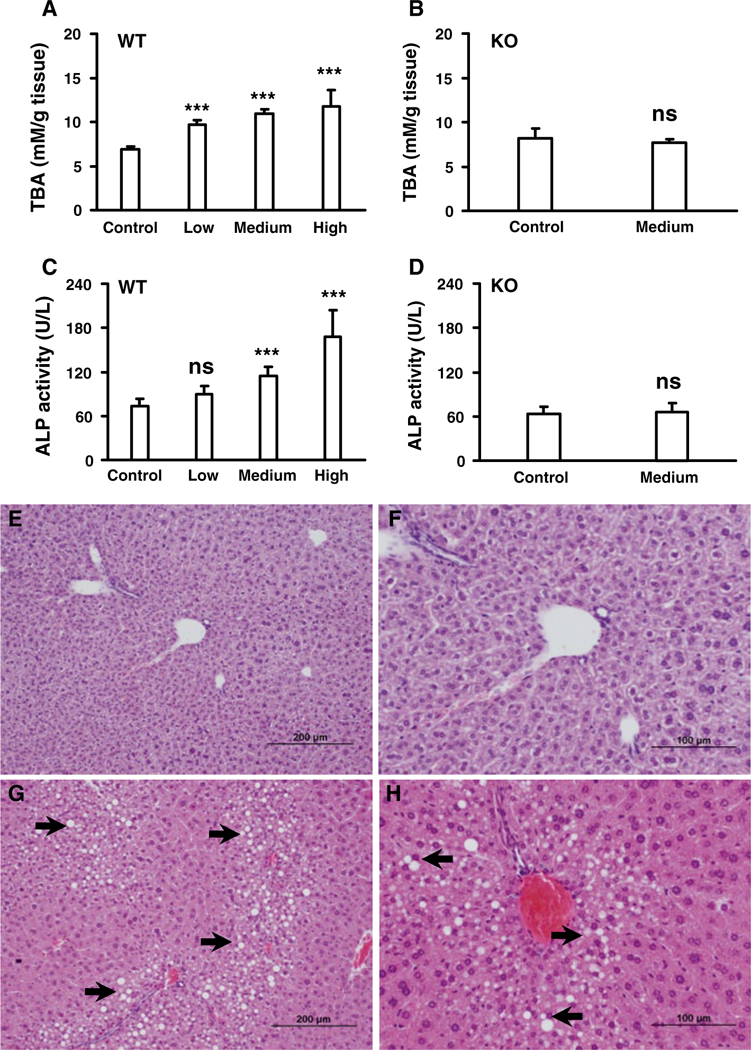
Analysis total bile acids (TBA) and toxicological responses in livers of wild-type (WT) and Ppara-null (KO) mice treated with gemfibrozil diet for 14 days. a Dose- dependent response of total bile acid levels in liver tissues from WT mice. b TBA level in liver tissues from KO mice. c Dose-dependent response of alkaline phosphatase (ALP) in liver tissues from WT mice. d Response of ALP in liver tissues from KO mice. e, f Representative pictures of liver tissues from WT control group. g, h Representative pictures of slight-to- moderate fatty liver in WT mice treated with low gemfibrozil diet. The data were expressed as mean ± SD (n = 5). The *, ** and, *** indicatep < 0.05, p < 0.01, and p < 0.001, respectively, compared with control or between indicated groups