
Fig. 3.
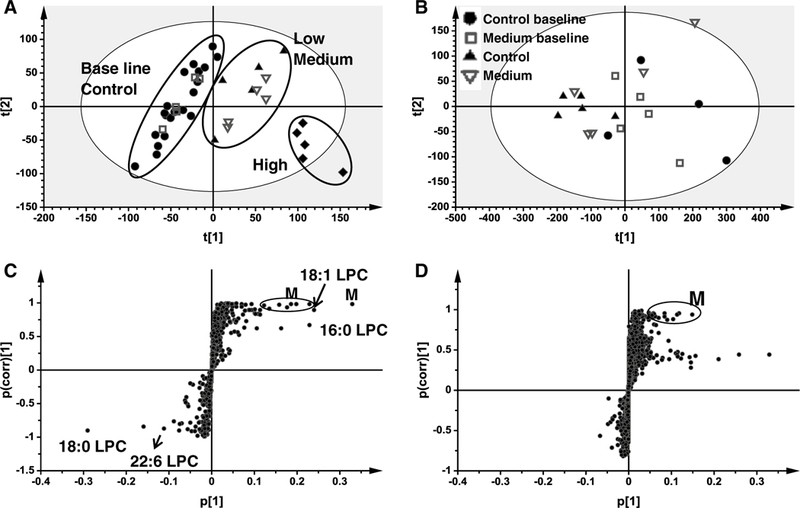
Multivariate data analysis of serum metabolome in positive mode in wild-type (WT) and Ppara-null (KO) mice dosed with gemfibrozil diet for 14 days. a Scores plot of serum metabolome in WT mice treated with three dosages of gemfibrozil diet as determined by PCA. b Scores plot of serum metabolome in KO mice dosed with medium gemfibrozil diet as determined by PCA. c S scatter plot of OPLS-DA recognized serum metabolome in control and treated WT mice, in which identified LPCs and supposed metabolites (M) were indicated. d S scatter plot of OPLS-DA recognized serum metabolome in control and KO mice treated medium gemfibrozil diet, in which supposed metabolites (M) were indicated. Each point represents an individual mouse serum sample (a, b) and a unique serum ion (c, d). Serum metabolites are labeled in the scatter plots. The t[1] and t[2] represent principal components 1 and 2, respectively. The p(corr)[1] represents the interclass difference, and p[1] represents the relative abundance of the ions. Raw data were obtained in positive mode (ESI+), ns means no significance when compared with control or between indicated groups