
Fig. 4.
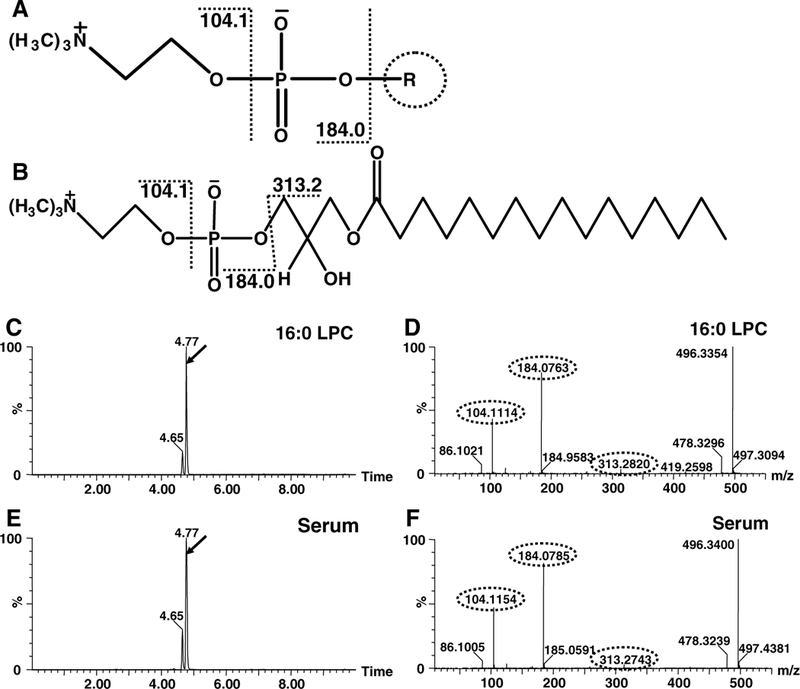
Exemplified identification of LPC 16:0 by fragmentation profiles and retention times on UPLC-ESI-QTOFMS. a common chemical scaffold of LPCs and supposed fragmentation pattern. b Chemical structure of identified LPC16:0 and supposed fragmentation. c Total ion count (TIC) chromatogram of standard LPC 16:0 when fragmentation performed. d MS/MS spectra of the peak with RT 4.77 in panel c. e TIC chromatogram of MS 496 of WT mouse serum sample when fragmentation performed. f MS/ MS spectra of the peak of WT mouse serum sample with RT 4.77 in panel e