


Fig. 5.
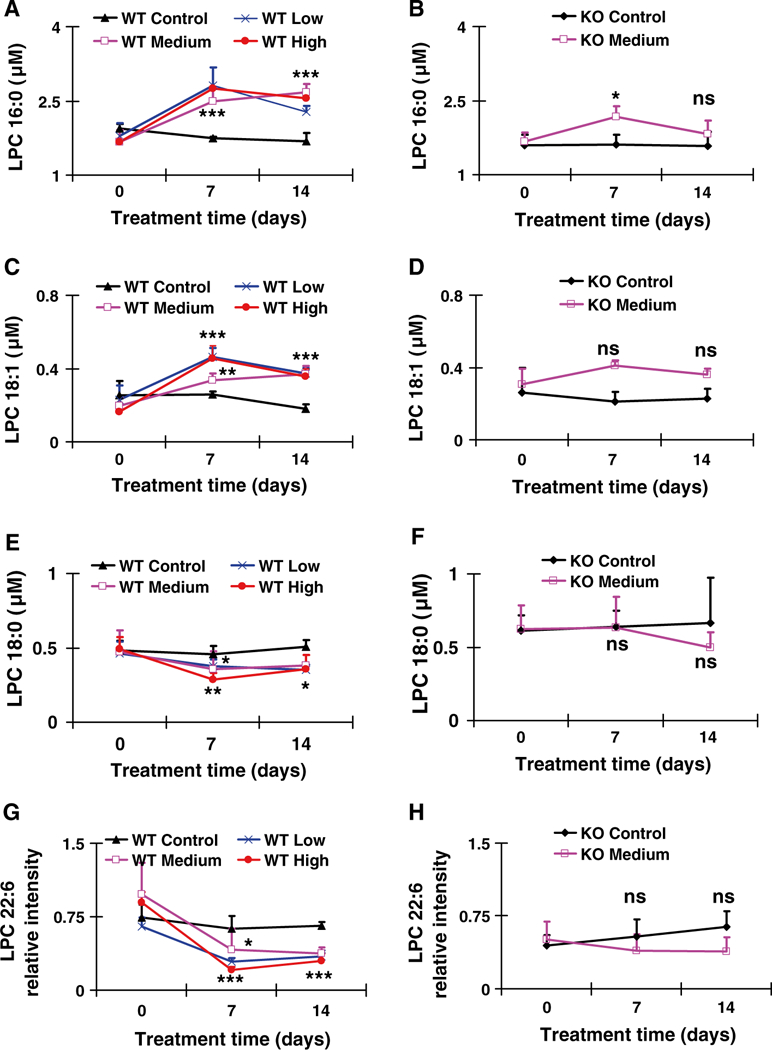
Concentration-time profiles or relative abundance of identified LPCs that were increased or decreased after treatment with gemfibrozil diet for 14 days. a, b Concentration-time profile of LPC 16:0 in WT and KO mice, respectively. c, d Concentration-time profile of LPC 18:1 in WT and KO mice, respectively. e, f Concentration-time profile of LPC 18:0 in WT and KO mice, respectively. g, h Relative abundance-time profiles of putative LPC 22:6 in WT and KO mice, respectively. The data were expressed as mean ± SD (n = 5). The *, **, and *** indicate p < 0.05, p < 0.01, and p < 0.001, respectively, compared with control or between indicated groups. ns means no significance compared with control or between indicated groups