


Fig. 6.
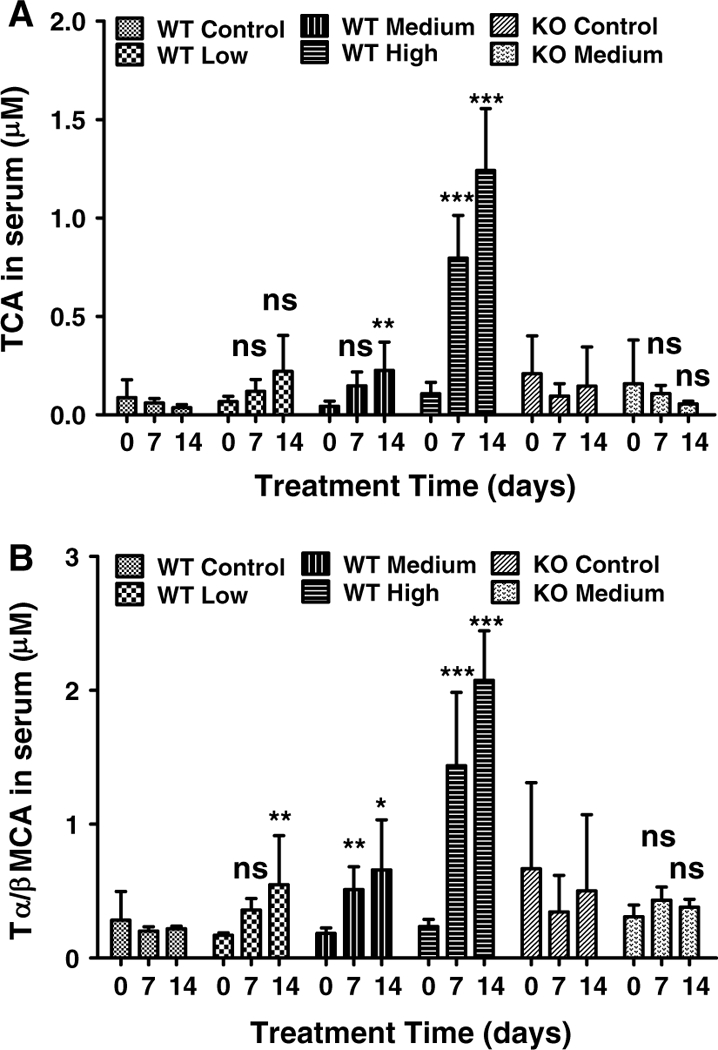
Concentration-time profiles of TCA and tauro-α-muricholic acid/tauro-β-muricholic acid in serum from wild-type (WT) and Ppara-null (KO) mice treated with gemfibrozil diet for 14 days. a TCA concentration-time profile in WT and KO mice on day 0, 7 and 14. b tauro-α-muricholic acid/tauro-β-muricholic acid concentration-time profile in WT and KO mice on day 0, 7 and 14. The data were expressed as mean ± SD (n = 5). The *, **, and *** indicate p < 0.05, p < 0.01 and p < 0.001, respectively, compared with control or between indicated groups. ns means no significance compared with control or between indicated groups