
Fig. 5 |. The F5111.2-hIL-2 complex preferentially increases Tregs in an in vivo NSG expansion model.
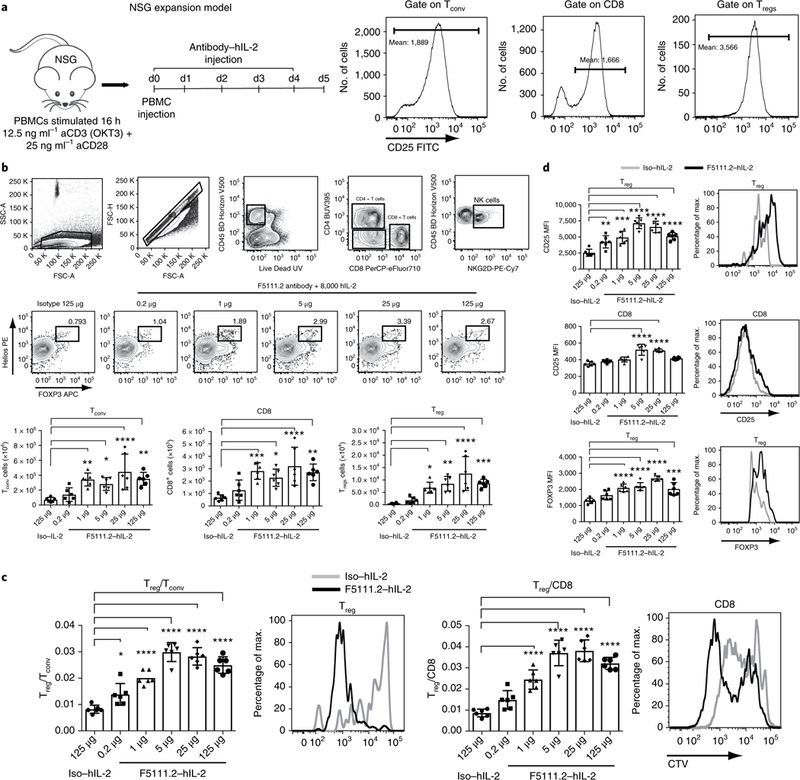
a, NSG expansion model. Human PBMCs were activated with polyclonal stimulation overnight, and injected into 12-week-old NSG mice. The mice received five consecutive days of F5111.2-hIL-2 complex treatment. CD25 expression (MFI) on human Tconv, Tregs and CD8+ T cells before injection at day 0. b, Gating strategy, Treg percentage in response to different doses of F5111.2-hIL-2 complex; Tconv, CD8 and Treg total cell number. c, Treg/Tconv and Treg/CD8 ratio after treatment with different doses of F5111.2 (0.2, 1, 5, 25 and 125 μg) and the isotype (125μg) in complex with 8,000 U (~0.49μg) hIL-2. Representative histograms show CellTrace Violet (CTV) dilutions of Treg and CD8 in response to F5111.2-hIL-2 complex (black line) compared to the isotype control (gray line). d, CD25 and FoxP3 MFI on Tregs and CD8 in response to different doses of F5111.2-hIL-2 complex. Representative histograms show CD25 and FoxP3 MFI on Tregs and CD8 in response to the isotype (gray line) and the F5111.2-hIL-2 complex (black line). For a-d, the experiment was repeated three times with similar results. One of three similar experiments is shown, with data presented as the mean± s.d. of six mice per group. The P values shown were determined by one-way ANOVA (Dunnett’s multiple-comparison test). *P≤0.05, **P≤0.01, ***P≤ 0.001, ****P≤0.0001.