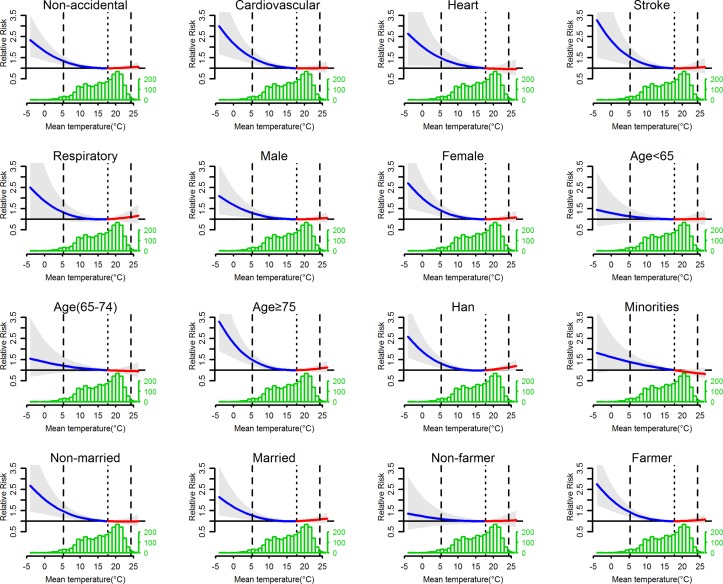
Figure 2.
Overall cumulative relative risk (with 95% empirical CIs, shaded grey) at a lag of 0–28 days in Yuxi, China, with histogram of daily temperature distribution. The dotted lines are the median of the mean temperature, and the dashed lines are the 2.5th and 97.5th percentiles of the distribution of mean temperature. The lines before and after the dotted lines represent the exposure response below (blue lines) and above (red lines) the median of mean temperature, respectively.

