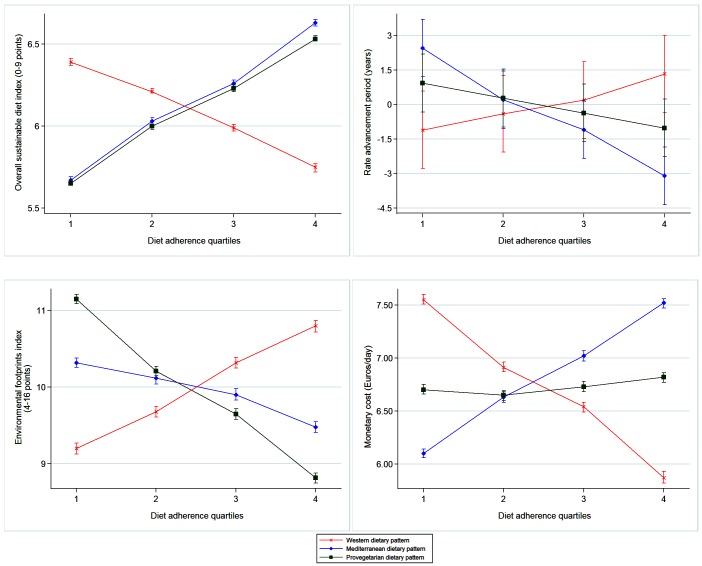
Figure 1.
Adjusted means and 95% CIs of overall sustainable diet index, rate advancement period, environmental footprints index and monetary cost, according to quartiles of Western, Mediterranean and Provegetarian dietary patterns adherence. Adjusted for age, sex and total energy intake. Red line, cross: adherence to the Western dietary pattern. Blue line, diamond: adherence to the Mediterranean dietary pattern. Green line, square: adherence to the Provegetarian dietary pattern.

