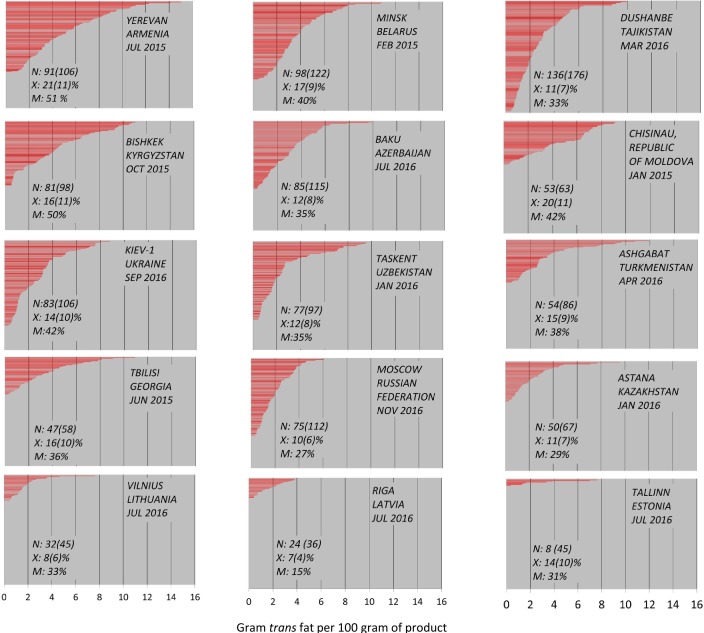
Figure 1.
Amounts of industrially produced trans fat (I-TF) in 100 g of prepackaged biscuits/cakes/wafers purchased from 2015 to 2016 in three supermarkets in each of the 15 capitals. Each bar in a panel represents a unique product that was bought in that capital. N is the number of different products with more than 2% TF in the total fat content. (N) is the number of packages that met the inclusion criteria. X is the mean value and the SD of the percentages of I-TF in the total fat of the N products, M is the maximal value of I-TF as a percentage of total fat. Each bar in all 15 panels has the same thickness, which means that the area of the bars is comparable between the different panels.

