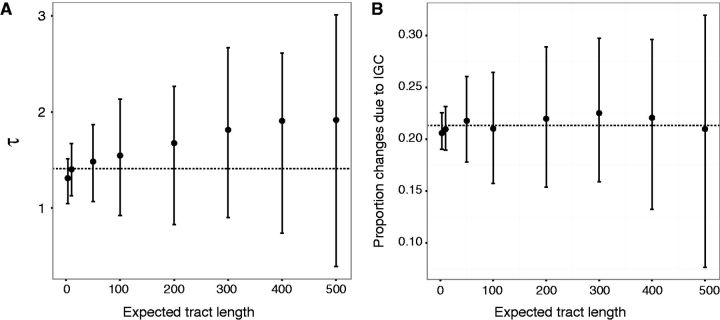
Fig. 3.
Effect on parameter estimates of expected tract length. A . The mean estimate of τ among 100 simulated data sets is plotted versus the expected length in nucleotides of IGC tracts. Vertical line segments depict interquartile ranges of the estimates. The horizontal line shows the true value . B . The average among 100 simulated data sets of the estimated proportion of nucleotide changes originating with IGC rather than point mutation is plotted versus the expected length in nucleotides of IGC tracts. Vertical line segments depict interquartile ranges of the estimates. The horizontal line at 0.2131 represents the estimate of the proportion of changes due to IGC in the actual data.

