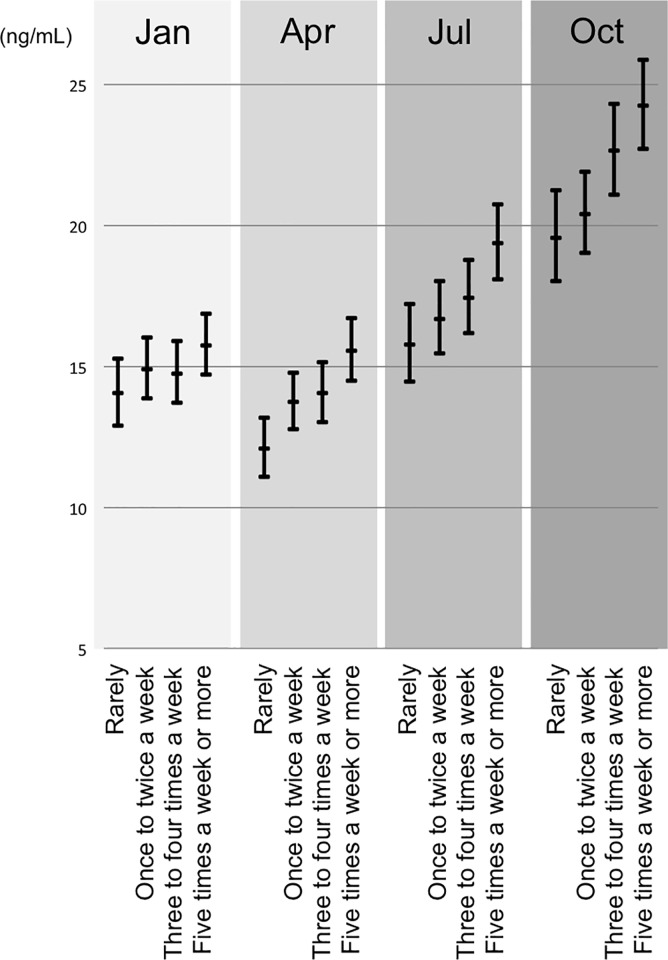
Fig 3. Serum 25(OH)D levels during each month in relation to the frequency of sunlight exposure.
Linear mixed model with random effect of repeated measurements. Adjusted by location, dietary vitamin D intake, dietary calorie intake, vitamin D supplementation, pregnancy trimester, and if they live with children.

