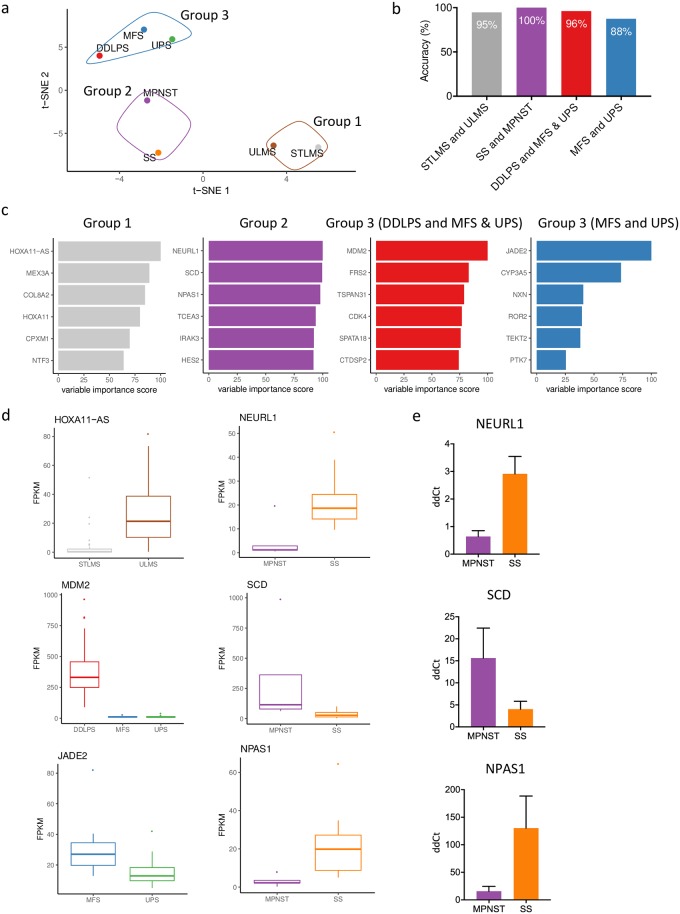
Fig 2. Diagnostic markers to distinguish within three subgroups.
(a) T-SNE analysis of all soft tissue sarcoma subtypes in the TCGA. The first two components were used to generate the diagram. Three groups could be identified based on the molecular profile: group 1 (STLMS and ULMS); group 2 (SS and MPNST); group 3 (DDLPS, UPS and MFS). (b) A machine learning random forest analysis was trained and tested on a test dataset. Random forests were generated to differentiate between STLMS and ULMS, SS and MPNST, DDLPS and MFS with UPS and last between MFS and UPS. Within the three identified groups a prediction accuracy of over 95% was reached, except when differentiating between UPS and MFS (88%). (c) From the random forest models, the top five genes were selected based on their Gini index, score is shown relative to the best diagnostic marker. (d) Gene expression (in FPKM) for the best subtype predictor within the identified groups is shown in the boxplots on the left. On the right the top three subtype predictors are shown for group 2 (MPNST and SS), which were verified using qRT-PCR. The box shows the interquartile range from Q1 to Q3 and the mean. The whiskers show the highest and lowest values. Suspected outliers (interquartile range * 1.5) are shown as separate dots. (e) qRT-PCR validation in independent cohort: Delta-delta Ct (ddCt) values are shown for the top three diagnostic genes identified for group 2 (MPNST and SS). Expression pattern is similar to what was found in the TCGA data. Expression was normalized with a housekeeping gene (HPRT1).

