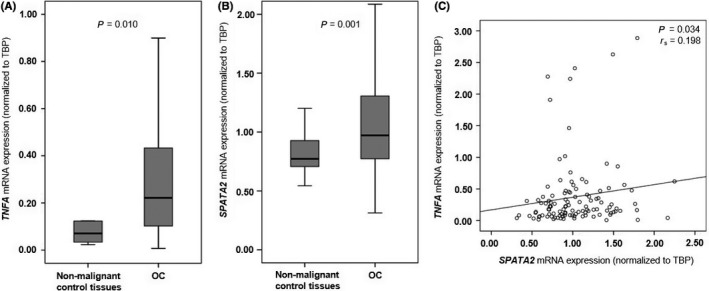
Figure 1.

TNFA and SPATA2 expression is elevated in ovarian cancer (OC) tissue compared with non‐neoplastic fallopian tubes. A, TNFA expression in non‐neoplastic control tissues (fallopian tubes, n = 7; ovaries, n = 3) and OC (n = 105). B, SPATA2 expression in non‐neoplastic control tissues (fallopian tubes, n = 14; ovaries, n = 14) and OC (n = 170). C, Linear regression analysis of TNFA (n = 115) and SPATA2 (n = 198) in non‐malignant control tissues and OC. TNFA and SPATA2 mRNA expression values were normalized to TBP expression
