
Figure 2.
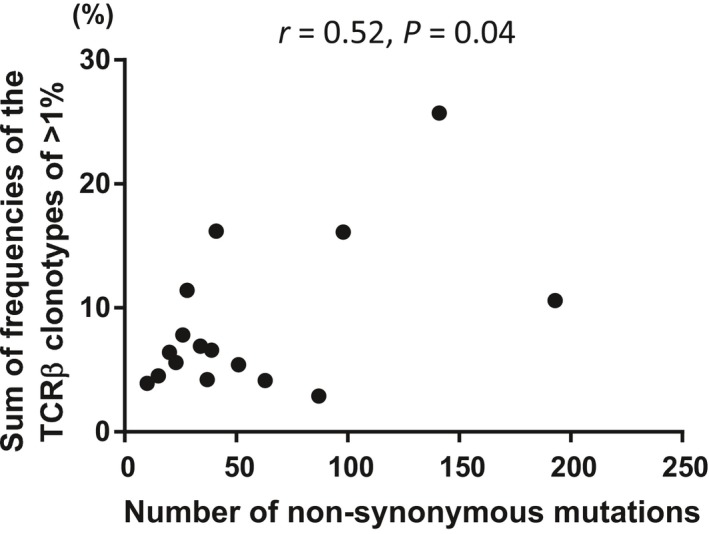
Correlation analysis of the number of non‐synonymous mutations and the sum of frequencies of the TCRβ clonotype of 1% or higher. The number of non‐synonymous mutations was significantly correlated with the sum of frequencies of the TCRβ clonotype of 1% or higher. TCR, T cell receptor