Figure 8.

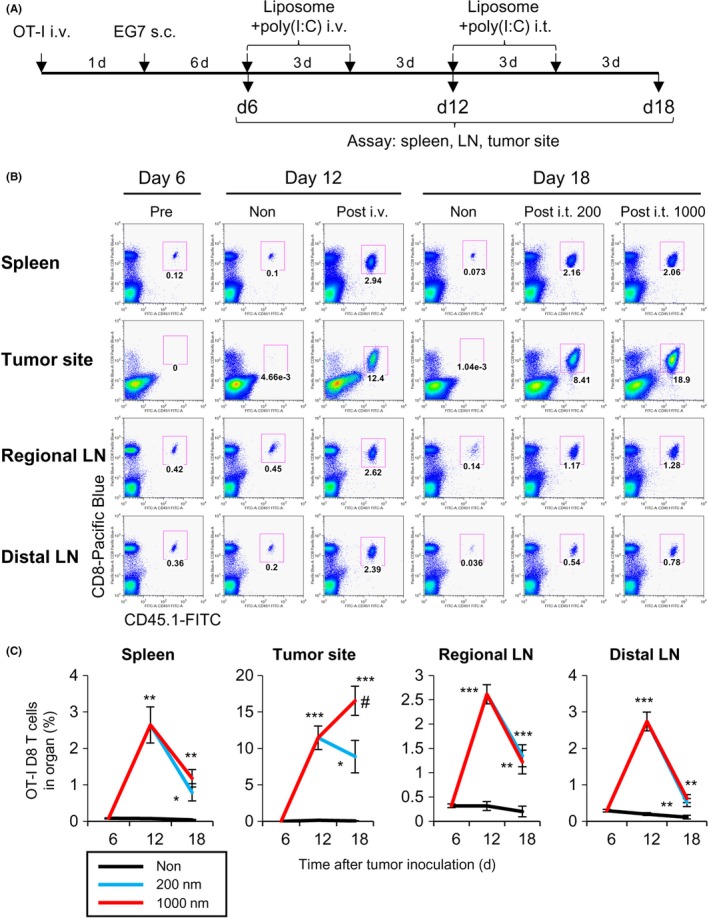
Dynamics of antigen‐specific CD8 T cell response in lymphoid tissues and tumor sites in antigen‐containing liposome‐immunized mice. A, Scheme of the experimental protocol; OT‐I cells were transferred to monitor T cells. CD8+ OT‐I T cells were transferred to mice, and EG7 tumors were inoculated on the following day. The mice were treated i.v. twice with large liposome‐encapsulated ovalbumin (OVA) together 25with polyinosinic‐polycytidylic acid (poly(I:C)) on days 6 and 9. The mice were boosted by liposome‐encapsulated OVA and poly(I:C) intratumorally (i.t.) on days 12 and 15. B, OT‐I CD8+ T cells were analyzed as CD3 and TCR Vα2+ T cells after gating CD8+ CD45.1+ cells. Representative dot plots from 4 independent experiments (n = 6‐7). C, Frequency of OT‐I CD8 T cells at the indicated time points. Data were pooled from 4 independent experiments (n = 6‐7). Significance of difference between vehicle and 200‐nm or 1000‐nm liposomes: *P < .05, **P < .01, ***P < .001. Significance of difference between 200‐nm and 1000‐nm liposomes: # P < .05, Student's t test. LN, lymph node
