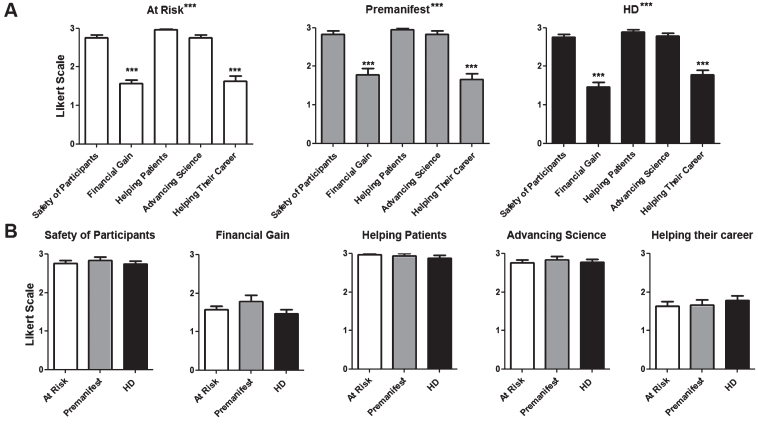
Fig.4.
How participants perceive the investigators’ motivation to conduct trials. Questions were asked regarding the participant’s impression of the researcher motivations to conduct clinical trials. The same Likert scale as in Fig. 3 was used. A) Average score for questions per diagnostic group. B) Average score for each individual question for each. Difference between questions (A) or groups (B) were calculated using ANOVA (when present, significance noted in the title above each graph) with Dunnett pot-test comparison of all versus the first column (when present, significance noted above each column). *p < 0.05; **p < 0.01; ***p < 0.001.

