
Figure 3.
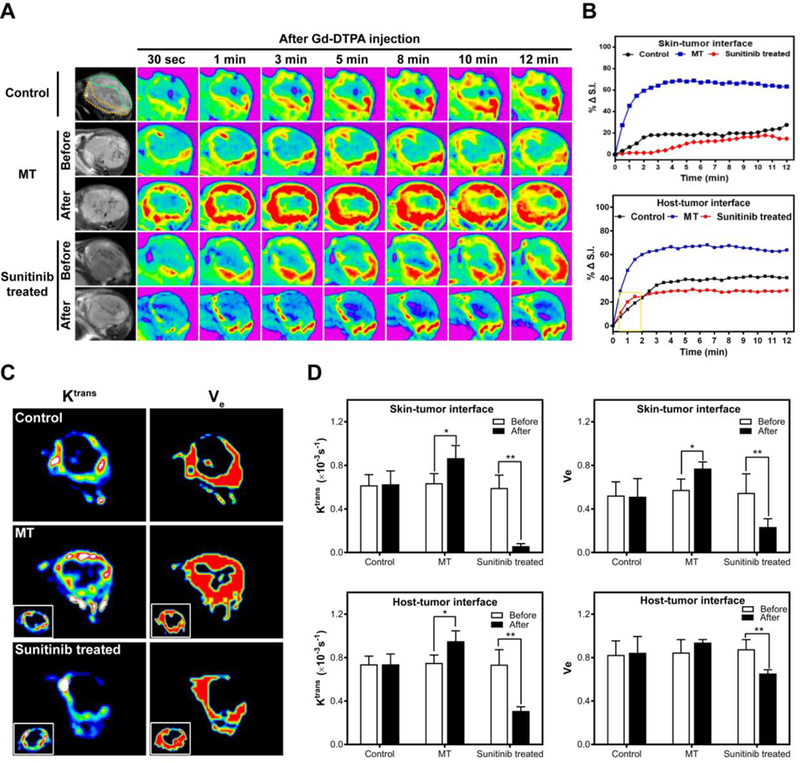
DCE-MRI of control, MT-treated and sunitinib-treated tumors. (A) T1-weighted images were taken at different time points after iv injection of Gd-DTPA. (B) Relative signal intensity (%ΔS.I.) time curve of the ROI. (C) Ktrans – and Ve –mapping. (D) Ktrans and Ve changes after vasculature modification. * P<0.05, ** P<0.01.