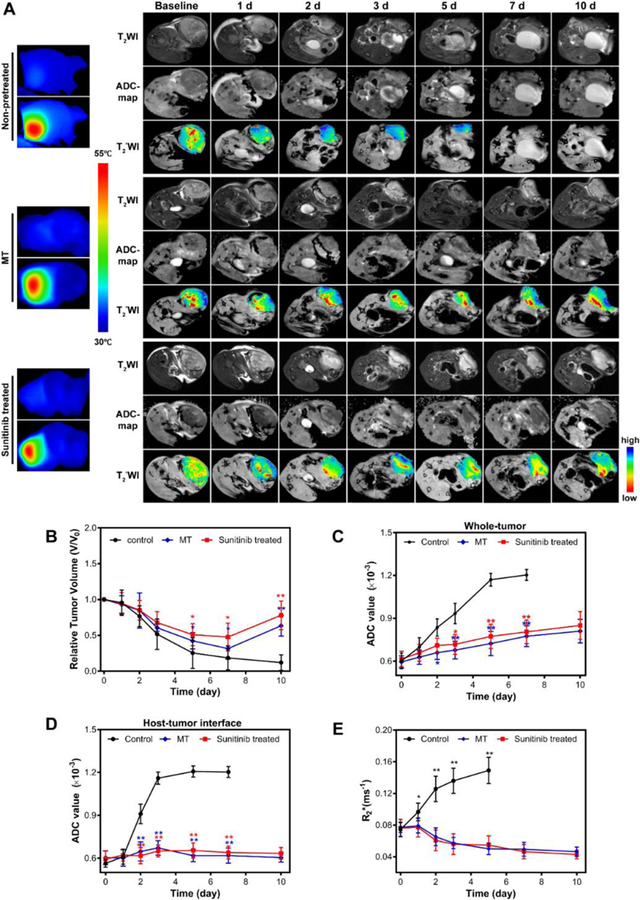
Figure 6.

(A) Temperature mapping of tumors during PTT and T2–weighted, ADC map and T2*-weighted images taken at different time points after PTT of pretreated or non-pretreated tumors. Pseudocolor R2*-map was overlapped with T2*-weighted images to highlight the signal intensity changes. (B) Tumor growth curve measured by T2–weighted MRI. (C) ADC value changes of whole tumor after PTT combined with vasculature modification or not. (D) ADC value changes of host-tumor interface. (E) Tumor R2* changes. Lower R2* values indicate better tissue oxygenation.
