
Figure 1 -. Hypoxic metabolism suspends the circadian clock through generation of acid.
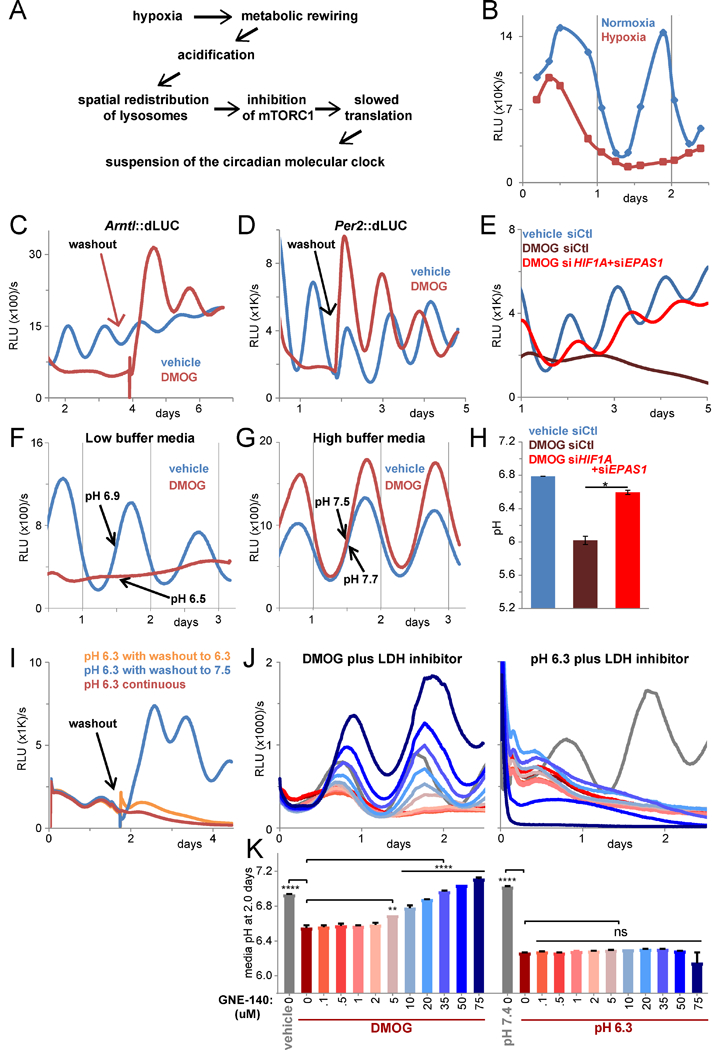
A. Graphical summary. B. Lysate luciferase activity (relative light units (RLU) per second) of U2OS Arntl::dLUC cells in normoxia or hypoxia (1% O2). RE of 2, 1–3 BR each. C. Luminescence of U2OS Arntl::dLUC cells treated with 750 uM DMOG or vehicle. DMOG washout at 4 d. RE of >5. D. Per2::dLUC as in C with 1 mM DMOG. Vehicle/DMOG washout at 7 d. RE of 2, 1–3 BR. E. Luminescence of U2OS Arntl::dLUC cells treated with control siRNA (siCtl) or siRNA against HIFα subunits prior to 750 uM DMOG. Mean of 3 BR. RE of 3. F./G. Luminescence of U2OS Arntl::dLUC cells treated with 1 mM DMOG or vehicle in low (F) or high (G) buffer media. Mean of 2 BR. RE of >5. Mean media pH after 1.5 d of 2 parallel BR (standard error of the mean (SEM) <0.05). H. Media pH after siRNA and 4 d DMOG treatment in low buffer media as in E. Mean of 2 BR ± SEM. T-test (unpaired, 2-tailed, unequal variances) *p≤0.05. I. Luminescence of U2OS Arntl::dLUC cells in triplicate in pH 6.3 media. Media of two plates exchanged for pH 7.5 (washout) or 6.3 (mock washout) media after 1.5 d. RE of >3. J./K. Luminescence (J) and media pH after 2 d (K) of U2OS Arntl::dLUC cells treated with vehicle or 750 uM DMOG (left) or pH 7.4 or pH 6.3 media (right) and the indicated concentration of GNE- 140 (color-coded as K). Mean of 2 BR (± SEM in K). One-way ANOVA/post-hoc Dunnett’s **p≤0.01, ****p≤0.0001, ns = p>0.05. RE of 3. All cells B-K synchronized (see Methods). d = days. h = hours. RE = representative experiment. BR = biological replicates. See also Figure S1.