
Figure 3 -. The normally circadian transcriptome ceases oscillation in acid.
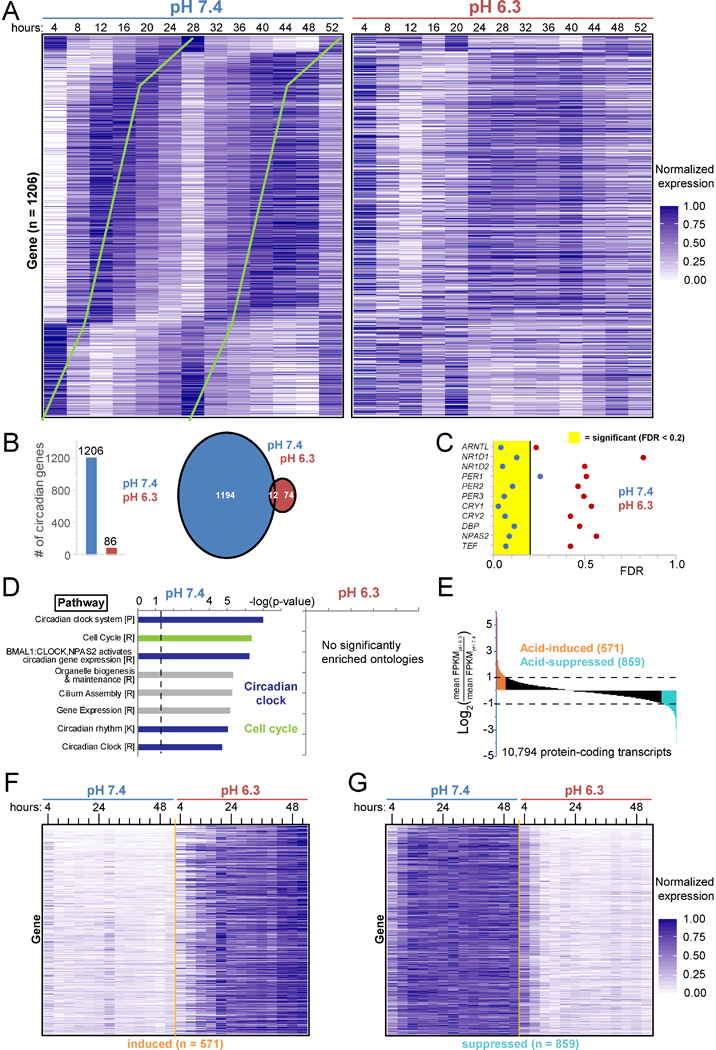
A. Expression (normalized fragments per kilobase of transcript per million (FPKM) mapped reads) of the 1206 proteincoding genes circadian in pH 7.4 (p<0.05, false discovery rate (FDR) <0.2) every 4 h for 52 h in synchronized U2OS Arntl::dLUC cells treated with pH 7.4 and 6.3 media. Ordered by pH 7.4 phase. Green lines highlight circadian periodicity. B. Number of protein-coding genes with significant (defined as in A) circadian oscillation in pH 7.4, 6.3, or both. C. FDR statistic of test for circadian rhythmicity for representative clock network genes and output regulators in pH 7.4 or 6.3. D. Pathway ontologies significantly enriched (B&Y q <0.05) among circadian transcripts in B. P=PantherDB, R=Reactome, K=KEGG. p<0.05 above dashed line. E. Acid-induced and acid-suppressed transcripts defined as Log2 of the ratio of average expression over all 13 time points in pH 6.3 to pH 7.4 >1 or < −1. F/G. Expression in pH 7.4 and 6.3 of the 571 acid-induced (F) and 859 acid-suppressed transcripts (G) defined in E. See also Tables S1–6 and Figure S3.