
Figure 4 -. Acid suspends the circadian clock through inhibition of mTORC1.
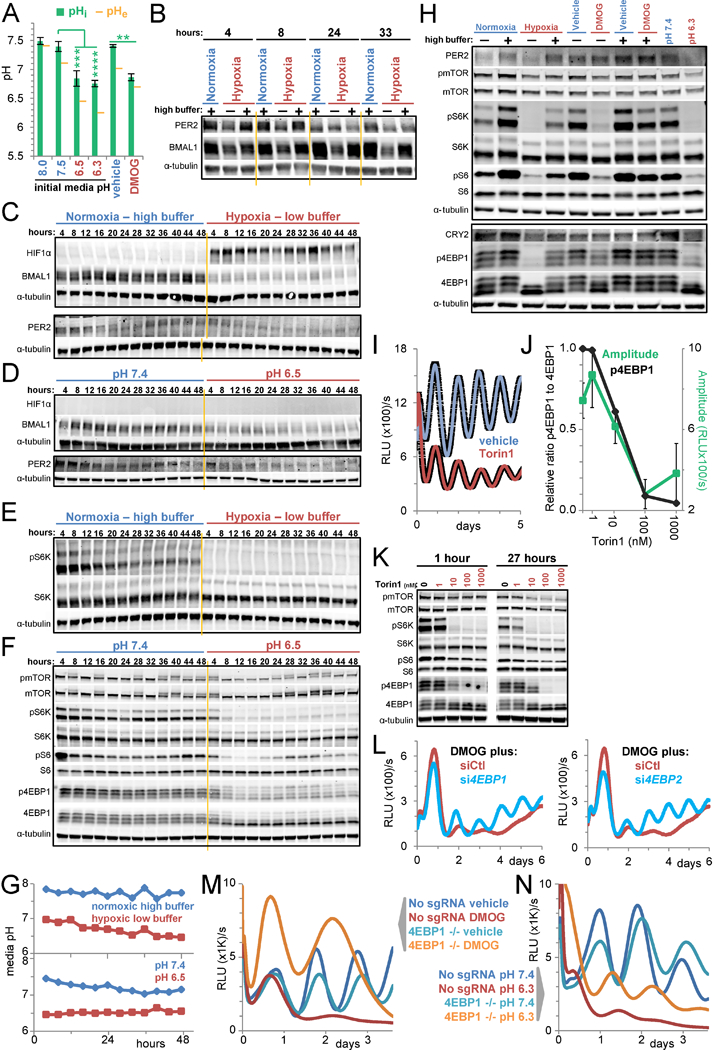
A. mCherry-SEpHluorin-derived intracellular pH (pHi) of U2OS cells treated for 24 h with the indicated pH media or with 500 uM DMOG in low buffer media. Extracellular pH (pHe) at 33 h. Mean pHi ± standard deviation (SD) based on ≥3 10× fields per condition (see Figures S4A-C). T-tests (unpaired, 2-tailed, unequal variances) of pHi ****p≤0.0001, ***p≤0.001, **p≤0.01. RE of 2–3 per condition. B. Timecourse immunoblots of core clock proteins in U2OS cells in normoxic high buffer or hypoxic (1% O2) low or high buffer conditions. C/D. Timecourse immunoblots for HIFIα and clock proteins in U2OS cells in normoxic high buffer or hypoxic (1% O2) low buffer conditions (C) or in pH 7.4 or 6.5 media (D). E/F. Immunoblots of lysate collected in C (E) and D (F) for phosphorylated sites (Ser2448 (mTOR), Thr389 (S6K), Ser235/236(S6), Thr37/46(4EBP1)) or total levels of mTORC1 substrates and downstream signaling components. Tubulin shared by E, C. G. Media pH over the 48 h in C-F. H. Immunoblots for core clock proteins and mTORC1 signaling in U2OS cells in normoxia or hypoxia (1% O2) or treated with vehicle or 300 uM DMOG in low or high buffer conditions or in media of pH 7.4 or 6.3 for 8 h. I. Luminescence of U2OS Arntl::dLUC cells treated with vehicle or 100 nM Torin1. Mean±SEM of 3 BR. RE of 2. J. Normalized ratio of the intensities of p4EBP1 to total 4EBP1 at 27 h (quantified from K) and the mean±SEM Arntl::dLUC amplitude over 4 days (see Methods) as functions of Torin1 dose. Y-axis scaled log([Torin]+1). K. Immunoblot for mTORC1 signaling in U2OS cells after 1 and 27 h of treatment with vehicle or 1–1000 nM Torin1. Unrelated intervening lanes cropped. L. Luminescence of U2OS Arntl::dLUC cells treated with 10 nM control (siCtl) siRNA or siRNA against EIF4EBP1 or EIF4EBP2 prior to 300 uM DMOG in low buffer media. Mean of 2 BR. RE of 2. M/N. Luminescence of U2OS Arntl::dLUC EIF4EBP1 CRISPR knockout (4EBP1 −/−) and editing control clonal lines treated with vehicle or 500 uM DMOG in low buffer conditions (M) or pH 7.4 or 6.3 media (N). Mean of 2–3 BR. RE of ≥3. Black rectangles enclose immunoblots from same gel. Yellow lines for readability only. All cells synchronized except A, K. Hypoxic medias pre-deoxygenated. RE = representative experiment. BR = biological replicates. See also Figure S4.