
Figure 6 -. Acid-induced peripheral redistribution of lysosomes silences signaling of lysosome-localized mTORC1.
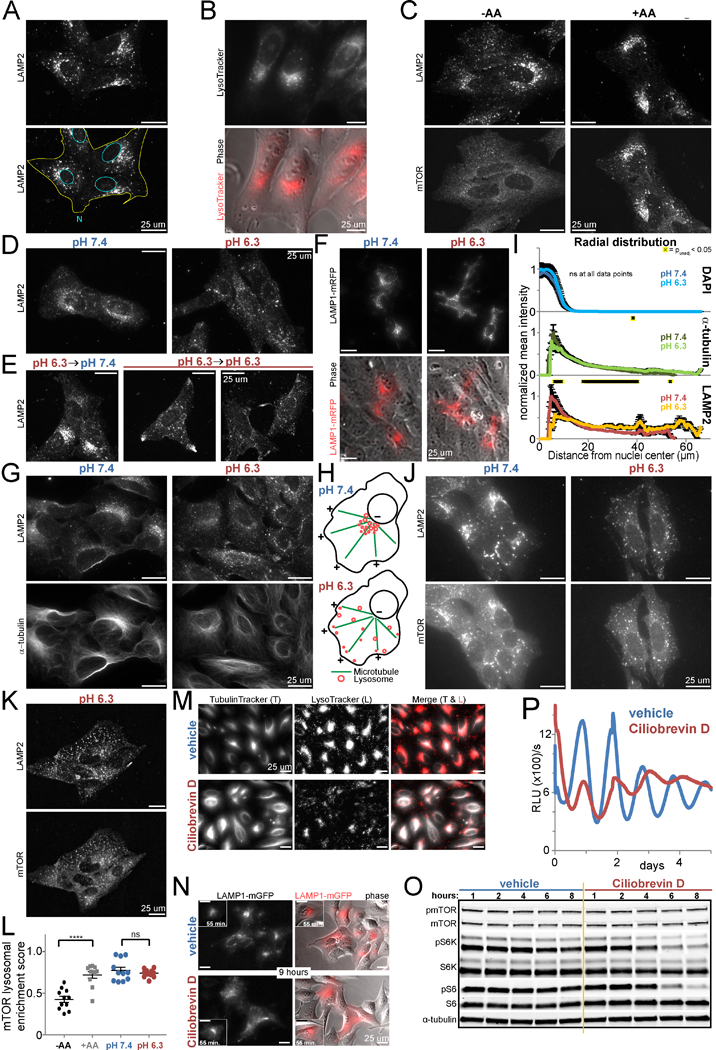
A. U2OS cells immunostained for lysosomal protein LAMP2. Nuclei and cytoplasm outlined in lower panel. B. Live imaging of U2OS cells with lysosomes labeled with LysoTracker. Lower panel merged with phase-contrast image. C. U2OS cells immunostained for LAMP2 and mTOR after amino acid starvation for 115 min and rescue (+AA) or not (-AA) for 25 min. D./E. U2OS cells immunostained for LAMP2 after in media of pH 7.4 or 6.3 for 2.25 h (D) or pH 6.3 for 105 min followed by media pH 7.4 (rescue, left) or 6.3 (mock rescue, right two fields) for 25 min (E). F. Live imaging of U2OS cells expressing LAMP1-mRFP in pH 7.4 or 6.3 media for 4 h. Lower panels: merged mRFP and phase-contrast images. G. U2OS cells immunostained for LAMP2 and α-tubulin after in pH 7.4 or 6.3 media for 2.25 h. H. Model: the perinuclear aggregate of lysosomes disperses peripherally upon acidification. I. Mean intensity of DAPI (nuclear), a-tubulin, and LAMP2 staining as a function of distance from the nucleus center (i.e. radial coordinate) after 2.75 h in pH 7.4 or 6.3 media. (See Figure S6E.) n=15 cells each pH. Mean±SEM normalized to each channel’s maximum. T-test of pH (unpaired, 2-tailed, equal variance) unadjusted p<0.05 (*) at 0, 2, and 117 of 228 data points, respectively. J./K. U2OS cells immunostained for LAMP2 and mTOR after amino acid starvation for 130 min in pH 7.4 or 6.3 media and restimulation with amino acids for 10 min in the same pH (J) or after incubation in pH 6.3 media for 2 h with media change (same pH) 15 min prior to processing (K). L. Quantification of mTOR lysosomal enrichment in U2OS cells immunostained for LAMP2 and mTOR after amino acid starvation for 155 min and rescue (+AA) or not (-AA) for 8 min or in pH 7.4 or 6.3 media for 165 min. n =11 fields (≥86 cells) per condition. Mean±SEM superimposed with raw data. T-tests (unpaired, 2-tailed) ****p<0.0001, ns = p>0.05. RE of 3. M. Live imaging of U2OS cells treated with vehicle or 40 uM ciliobrevin D (CbD) for 10.5 h. Lysosomes and polymerized tubulin labeled with LysoTracker and TubulinTracker. N. Live imaging of U2OS cells expressing LAMP1-GFP (red pseudocolor) after treatment with vehicle or 60 uM CbD for 55 min (inset) and 9 h (different fields). Right: merged GFP and phase-contrast images. O. mTORC1 signaling in U2OS cells over 8 h of vehicle (veh.) or 40 uM CbD treatment. RE of 3. P. Luminescence of U2OS Arntl::dLUC cells synchronized and treated with 50 uM CbD or vehicle. Mean of 2 BR. RE of 2, 2–3 BR each. Representative fields of ≥3 BR for all microscopy. RE = representative experiment. BR = biological replicates. See also Figure S6.