
Figure 7 -. Acid inhibits mTORC1 signaling and the clock by spatially separating RHEB and lysosome-bound mTORC1.
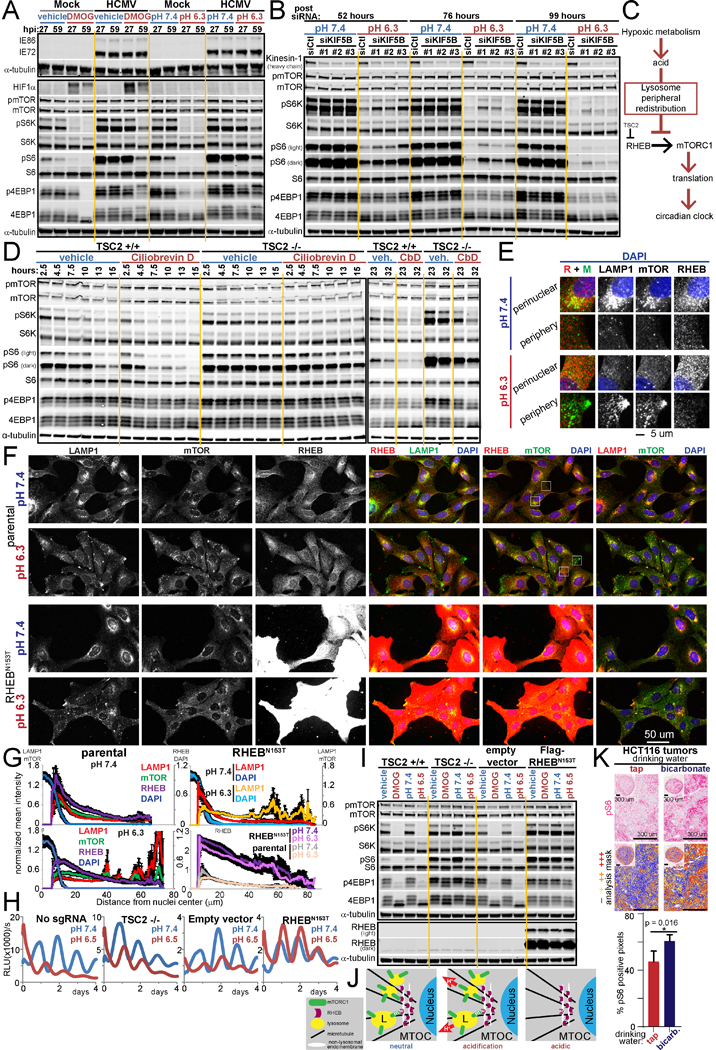
A. Immunoblots for mTORC1 signaling, HIFIα, and the human cytomegalovirus (HCMV) proteins IE72 and IE86 in HCMV-infected or uninfected (mock) U2OS cells treated with vehicle or 500 uM DMOG in low buffer media each for 8 and 12 h prior to harvest at 27 and 59 hours post infection (hpi), respectively, or in media pH 7.4 and 6.3 for 1 h prior to harvest. B. mTORC1 signaling and kinesin-1 heavy chain (HC) in U2OS cells at time points post delivery of 10 nM control (Ctl) siRNA or three different siRNA against KIF5B (kinesin-1 HC) and in pH 7.4 and 6.5 media 1 h prior to harvest. RE of 2. C. Model. Acid produced during hypoxic metabolic rewiring suppresses the circadian clock through inhibition of mTORCI-governed translation as a consequence of centrifugal redistribution of lysosome-bound mTORCI limiting mTOR activation by RHEB. D. mTORCI signaling over 32 h in TSC2 CRISPR knockout (−/−) or parental U2OS cells (+/+) treated with vehicle or 50 uM ciliobrevin D. E/F. Parental and RHEBN153T-expressing U2OS cells immunostained for LAMP1, mTOR, RHEB and nuclei (DAPI) after 160 min in pH 7.4 or 6.3 media. White boxes in F enlarged in E. RE of 3. G. Mean intensity of DAPI, mTOR, RHEB, and LAMP1 as a function of distance from the nucleus in F. n=10–13 cells each pH per cell line. Mean±SEM normalized to each channel’s parental pH 7.4 maximum. H. Arntl::dLUC luminescence in TSC2 CRISPR knockout (−/−), RHEBN153T-expressing, and respective control U2OS cells synchronized and in pH 7.4 or 6.5 media. Mean of 3 BR. RE of 3–4, 1–3 BR each. I. mTORC1 signaling in parallel to H or treated with vehicle or 500 uM DMOG in low buffer conditions for 20 h (TSC2) or 16 h (RHEBN163T). RE of 2. J. Model of trans-endomembrane contact between lysosome-localized mTORC1 and non-lysosomal RHEB disrupted upon acid-driven peripheral redistribution of lysosome-bound mTOR. MTOC = microtubule organizing center K. Immunohistochemical pS6 staining of HCT116 xenograft tumors hosted by mice drinking tap water or 200 mM sodium bicarbonate ad libitum throughout tumor hosting (up to 3 weeks). Representative high-power fields and inset low-power images of entire tumor cross section. Positivity mask in lower panels. Percent pS6 positive pixels quantified over entire viable area of tumor cross section. Mean±SD n=4 mice each arm. 2-tailed Student’s t-test. RE= representative experiment. Biological replicates = BR. See also Figure S7.