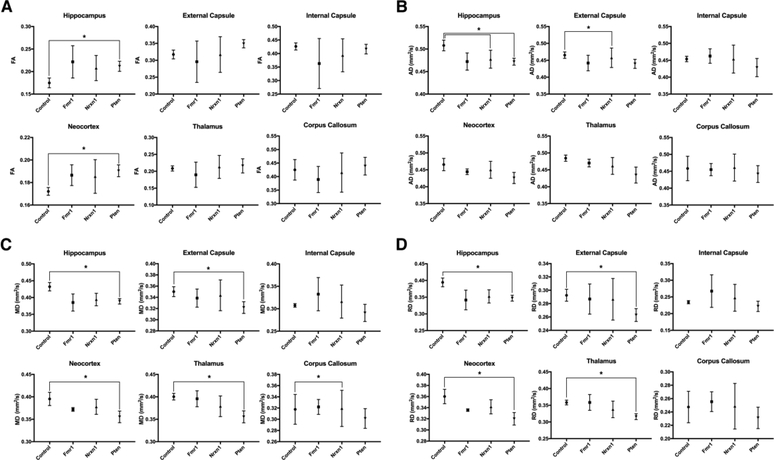
Figure 3.
Representative plots of FA (A), AD (B), MD (C), and RD (D) displaying the mean ± S.D. values for 6 regions of interest for control, Fmr1, Nrxn1, and Pten. Statistical differences, after Bonferroni correction, were identified between control and both Nrxn1 and Pten genetic variants in several regions of interest across all diffusion measures (indicated by starred (*) brackets). After correcting for multiple comparisons, intragroup comparisons between each genetic model within each region of interest showed no statistically significant difference in any of the four diffusion tensor metrics calculated. N.B. Units of measure for MD, AD, and RD are [10−3 mm2/s].

