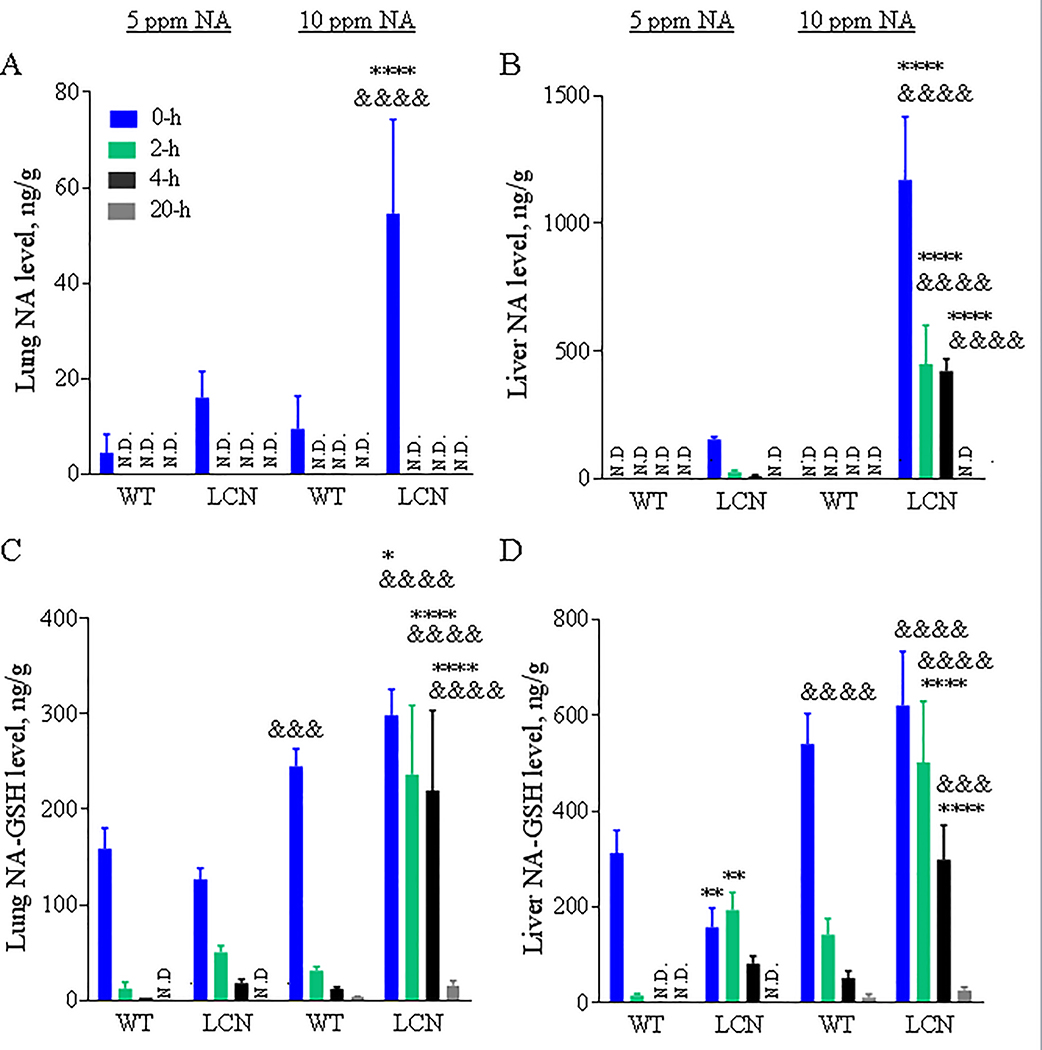
Fig. 2. NA and NA-GSH levels in mouse lung and liver after a single 4-hour nose-only inhalation exposure to different doses of NA.
Two-month old wild-type (WT) and liver-Cpr-null (LCN) male mice were exposed to 5 or 10 ppm of naphthalene (NA) for 4 h. Lung (A, C) and liver (B, D) were collected 0, 2, 4 and 20 hours after termination of NA exposure. NA (A, B) and naphthalene-glutathione conjugate (NA-GSH) (C, D) were detected in tissue homogenates. Data represent means ± SD (n=3–5). ****, p<0.0001; *, p<0.05; vs WT, of corresponding dose/time point; &&&&, p<0.0001; &&&, p<0.001; vs 5 ppm, of corresponding genotype/time point (two-way ANOVA followed by Bonferroni’s test for multiple comparisons).

