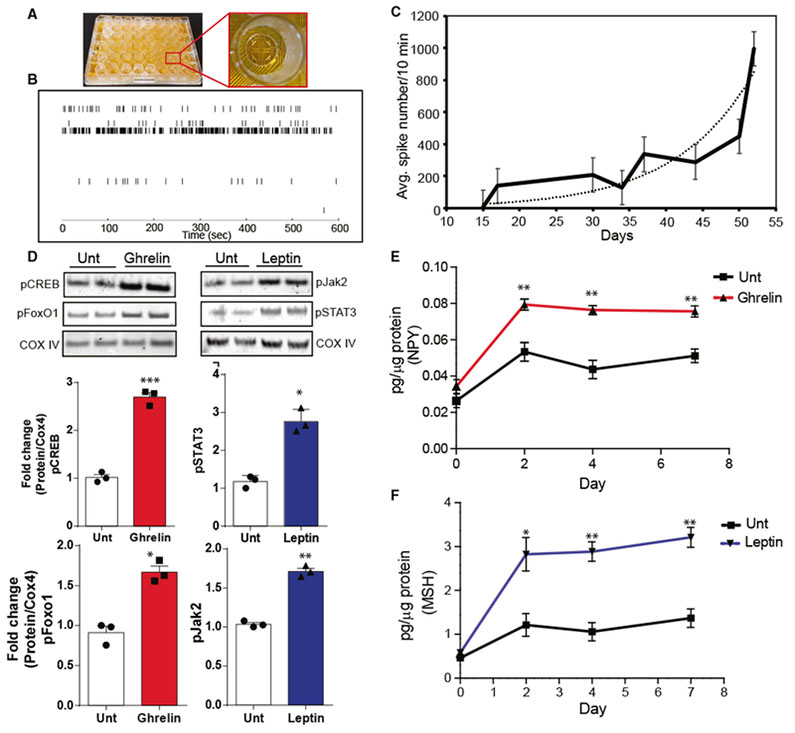
Figure 4. iHTNs Exhibit Electrical Activity and Response to Exogenous Peptides.

(A) An image of a 48-well microelectrode array (MEA) plate used for measuring neuronal electrophysiological activity over a 30-day period during iHTN differentiation and maturation.
(B) A representative raster trace of iHTNs in a well measured on day 52. Each horizontal row represents an electrode in the well.
(C) Plot representing average neuronal spike number in the iHTNs measured from day 15to day 50 of iHTN development (n = 6 lines in 3 × 48 wells with each line seeded in 24 wells of a plate).
(D) Representative immunoblots and densitometry quantification in histograms showing signaling response of iHTNsto either untreated (Unt) control orexposed to exogenous ghrelin (left) and leptin (right). Activation of the respective pathway proteins is demonstrated via pCREB and pFoxO1 for ghrelin signaling and pSTAT3 and pJak2 for leptin signaling.
(E and F) ELISA measurements showing increased NPY secretion with ghrelin treatment (E) and increased α-MSH secretion with leptin treatment (F). *p < 0.05, **p < 0.01, ***p < 0.001. Data shown are representative of results from differentiated iHTNs in n = 3 independent experiments.
Error bars represent SEM.
