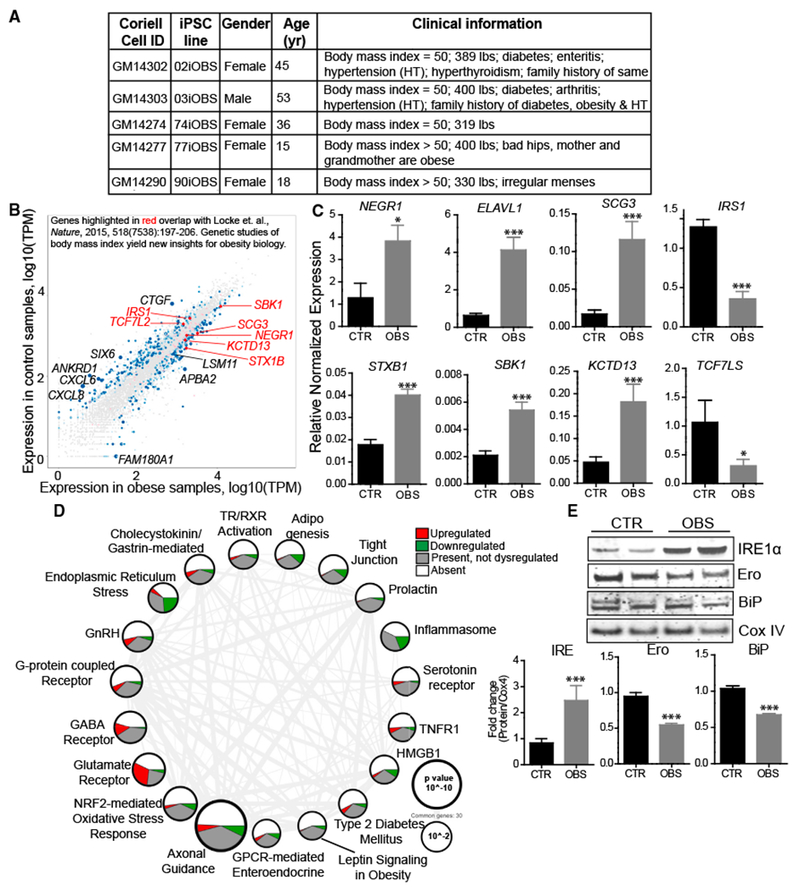
Figure 5. Transcriptome Profiling of iHTNs from Super-Obese Patients Displays Molecular Signatures of Metabolic Disease and Obesity.

(A) Patient information on super-obese (OBS) patient-derived hiPSC lines.
(B) Scatterplot highlighting dysregulated expression of genes in iHTNs derived from normal control (BMI < 25) versus OBS patients (BMI > 25) based on RNA sequencing data and correlated with obesity-related gene identified in Locke et al. (2015) (n = 12 lines).
(C) qRT-PCR validation of genes identified from Locke et al. (2015) showing increased expression of NEGR1, ELAVL1, SCG3, STXB1, SBK1, and KCTD13 and decreased expression of IRS1 and TCF7LS in the OBS group compared to CTR (n = 10 lines).
(D) Ingenuity PathwayAnalysis showing differentially regulated pathways. Size ofeach node representsthe p value, while thethickness of lines connecting each node represents the number of common genes shared between the two pathways (n = 12 lines).
(E) Immunoblot validation ofendoplasmic reticulum (ER) stress pathway, where OBS iHTNs confirm ER stress activation with an increase in IRE1α and a decrease in Ero and BiP compared to CTR (n = 3 independent experiments consisting of one CTR and one OBS line each). *p < 0.05, ***p < 0.001.
Error bars represent SEM.
