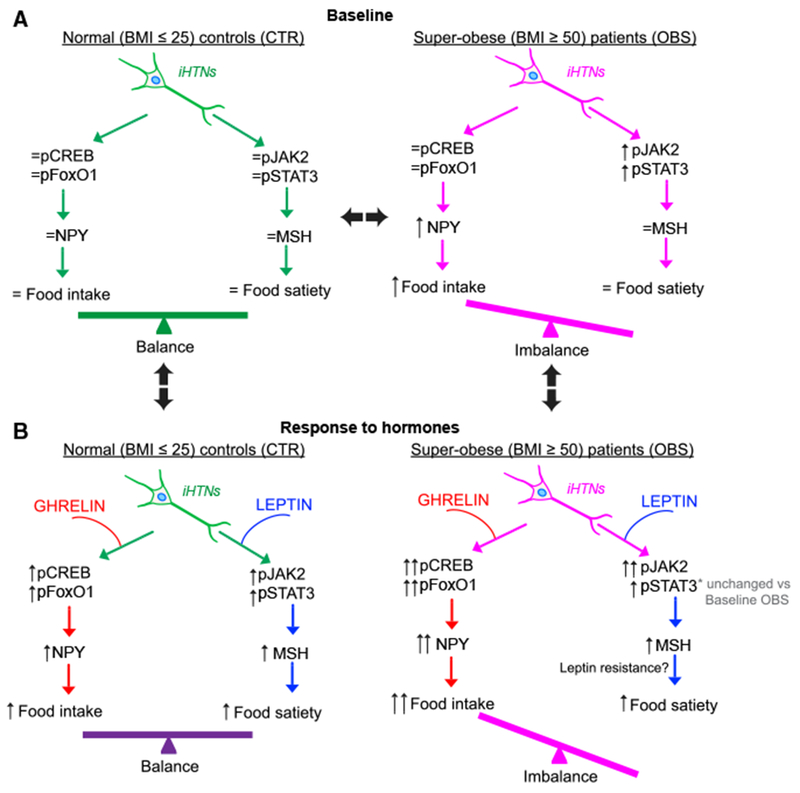
Figure 7. A Schematic Representation of the Hormonal Responses in CTR and OBS iHTNs in Baseline and Hormone-Treated Conditions.

(A) At baseline, CTR iHTNs (left) show baseline levels of orexigenic (pCREB and pFoxO1) and anorexigenic pathway proteins (Jak2 and STAT3) and a baseline response to added hormones to maintain a balance between food intake (NPY) and energy expenditure (α-MSH). At baseline, OBS iHTNs (right) show an imbalance in food intake versus energy expenditure in that there is an activation of the orexigenic pathway while the anorexigenic pathway is not equally active.
(B) Upon treatment of relevant hormones such as ghrelin (orexigenic) and leptin (anorexigenic), the CTR iHTNs (left) maintain their balance between food intake and energy expenditure. Interestingly, OBS iHTNs (right) show a further imbalance in that there is a further increase in orexigenic signals upon ghrelin treatment, but leptin does not elicit an equally effective anorexigenic response. As a result, OBS iHTNs show exacerbated orexigenic signals as well as possible resistance to leptin.
