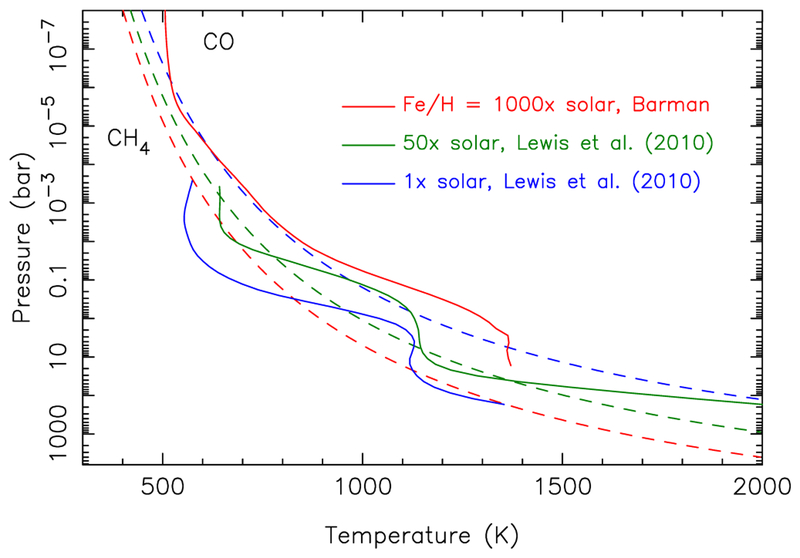
Fig. 1.—
Theoretical thermal profiles (solid lines) for GJ 436b assuming various atmospheric metallicities. The profiles for 1× solar metallicity (blue) and 50× solar metallicity (green) are the atmospheric temperatures averaged over the dayside of GJ 436b at secondary-eclipse conditions from the GCMs of Lewis et al. (2010); the profile for 1000× solar metallicity (red) is from a 1-D, inefficient-heat-redistribution calculation based on Barman et al. (2005). The dashed lines represent the boundaries where CH4 and CO have equal abundances in chemical equilibrium for the different metallicity models, with the color coding remaining the same as for the thermal profiles. Methane dominates to the lower left of these curves, and CO dominates to the upper right. A color version of this figure is available in the online journal.

