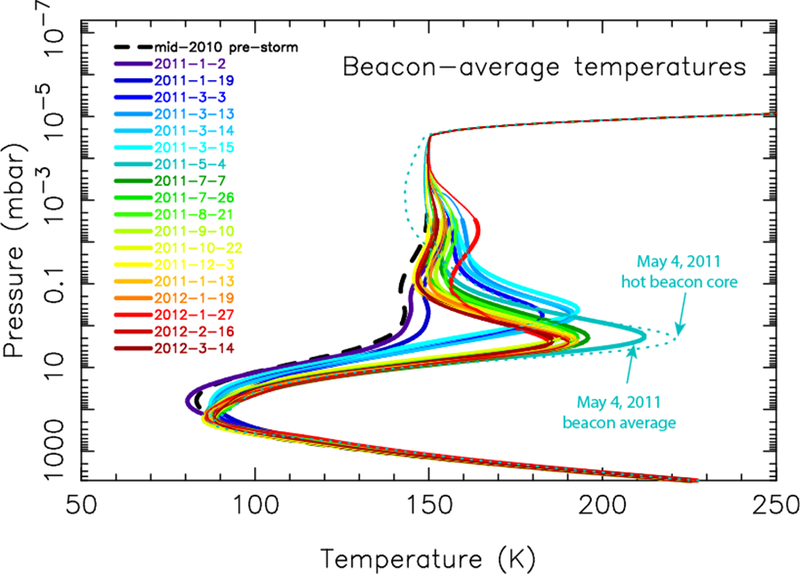
Figure 1:

Evolution of the vertical temperature profiles within one of the initial beacons (‘B1’) and the merged beacon (‘B0’) as a function of time after the storm onset, as retrieved by Fletcher et al. (2012) from Cassini CIRS spectra coadded from regions within ± 5° latitude and ± 10° longitude of the beacon centers. Dates of the observations are color-coded, as labeled. The actual retrievals are shown by the thicker lines, while the thinner lines at high altitude show model profiles artificially expanded beyond the pressure range of CIRS sensitivity (i.e., the actual published CIRS retrievals extend to ~10−3 mbar, although note that the nadir temperature retrievals lose their sensitivity beyond the ~0.5–230 mbar range). Although our photochemical models require extensions to higher altitudes, no simultaneous temperature data exist for the beacon regions at such high altitudes. The dotted line represents the retrieved thermal profile from the hottest region of the beacon on May 4, 2011. Figure is adapted from Fletcher et al. (2012).
