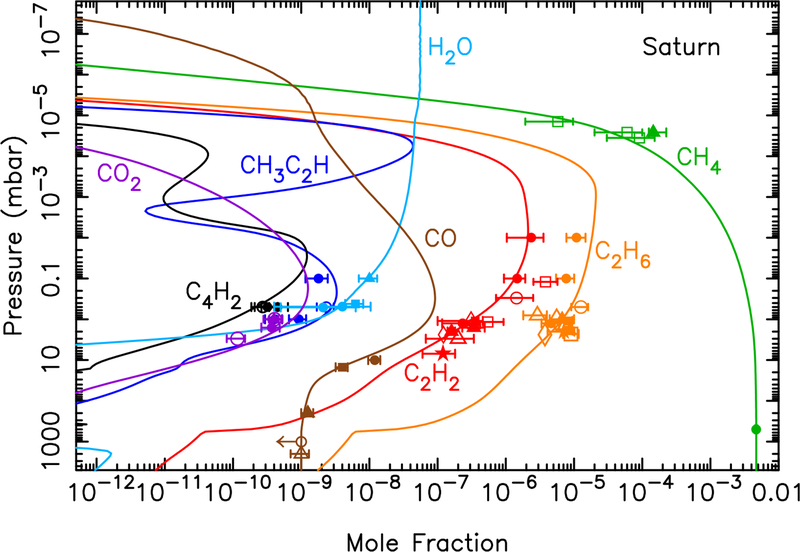
Figure 11:
Mixing ratio profiles for several species (as labelled) in Saturn’s atmosphere for a model that includes a source of H2O flowing in at the top of the atmosphere from a local source such as Enceladus, and a cometary source from an impact that occurred 400 years ago, along with a background injection rate of 6.7 × 10⁴ CO molecules cm−2 s−1 and 7.2 × 10³ H2O molecules cm−2 s−1 from the ablation of icy grains.

