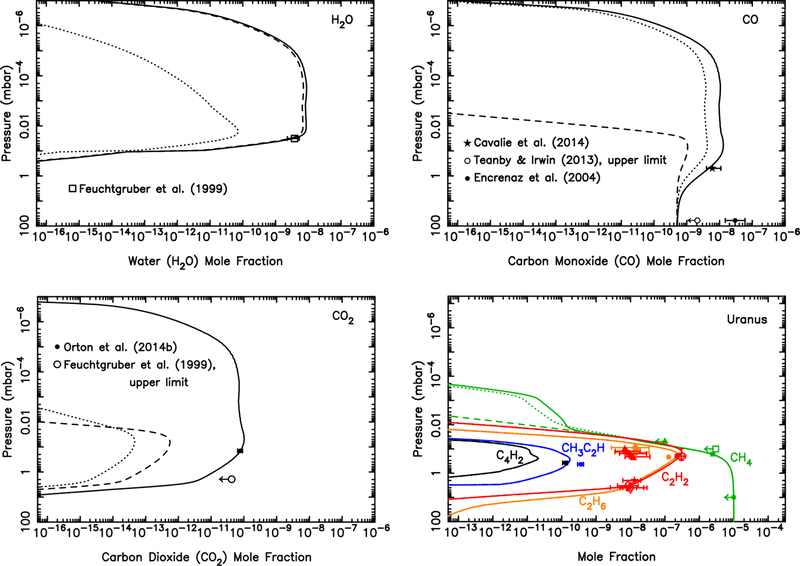
Figure 12:
Mixing ratio profiles for H2O (Top left), CO (Top right), CO2 (Bottom left), and several hydrocarbons (Bottom right), as labeled, in Uranus’ atmosphere as a result of the ablation of oxygen-rich icy grains. The dashed lines represent a model in which all the ablated icy component is released as water (integrated flux of ~9 × 10⁴ H2O molecules cm−2 s−1), the dotted lines represent a model in which all the ablated icy component is released as carbon monoxide (integrated flux of 9.0 × 10⁴ CO molecules cm−2 s−1), and the solid lines represent a model in which the relative influx rates (1.2 × 10⁵ H2O molecules cm−2 s−1, 2.7 × 10⁵ CO molecules cm−2 s−1, 3.0 × 10³ CO2 molecules cm−2 s−1) are scaled to fit the H2O, CO, and CO2 observations of Feuchtgruber et al. (1999), Cavalié et al. (2014), Teanby and Irwin (2013), and Orton et al. (2014b). The data points with error bars represent various observational constraints (see text). (For interpretation of the references to color in this figure legend, the reader is referred to the web version of this article.)

