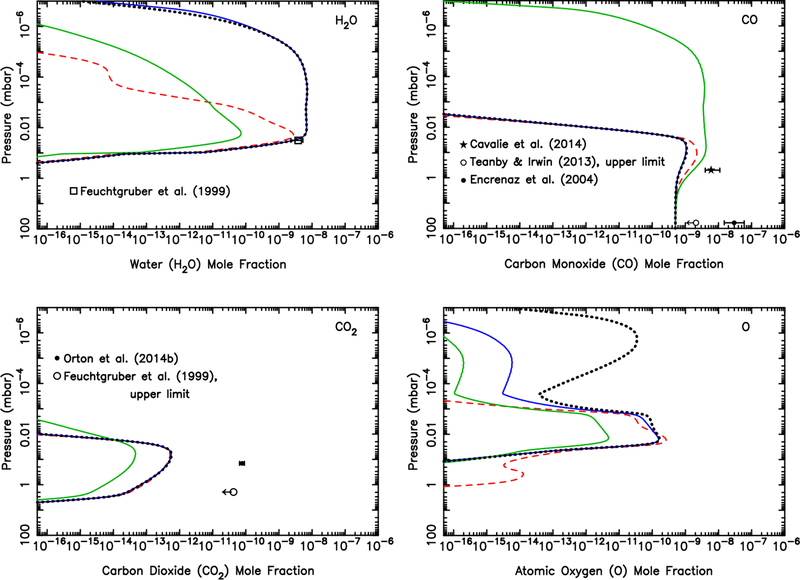
Figure 17:
Mixing ratio profiles for H2O (Top left), CO (Top right), CO2 (Bottom left), and O (Bottom right) on Uranus under the assumption that all the oxygen in the ices arrives in the atmosphere as (1) CO, with the icy grain ablation profile shown in Fig. 6 (green curves); (2) H2O, with the icy grain ablation profile shown in Fig. 6 (blue curves); (3) O, with the icy grain ablation profile shown in Fig. 6 (dotted black curves); (4) O, with the silicate grain ablation profile shown in Fig. 6 (dashed red curves). Above the methane homopause, chemical reactions largely convert the atomic O to H2O, while below the homopause, the O is converted to CO. (For interpretation of the references to color in this figure legend, the reader is referred to the web version of this article.)

