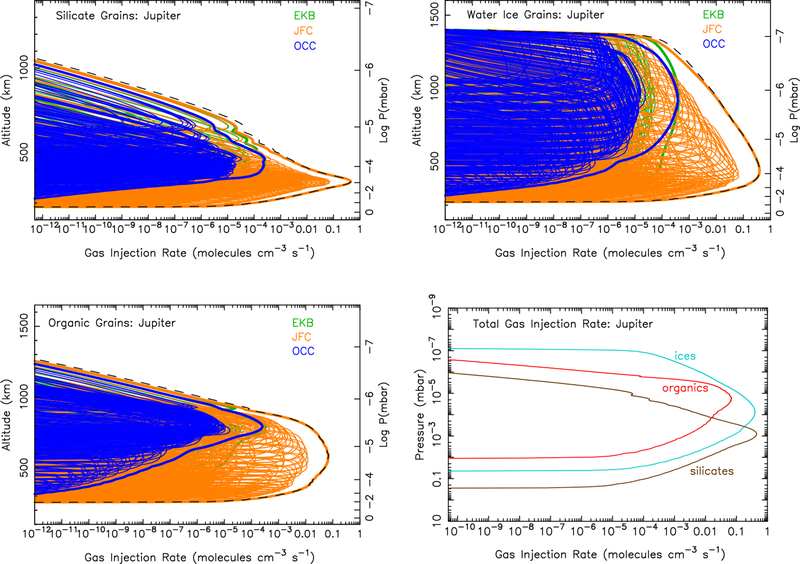
Figure 4:
Ablation rate profiles at Jupiter for silicate grains (Top left), water-ice grains (Top right), organic grains (Bottom left), and the total ablation rate from each component (Bottom right). The colored lines in the first three panels show the ablation profiles from each individual entry velocity and mass bin for the Edgeworth-Kuiper belt grains (green), Jupiter-family comet grains (orange), and Oort-cloud comet grains (blue). The thicker colored lines show the sum of all grains within each of these three populations, and the black dashed lines show the sum of all grains from all populations. These totals from all populations are shown as a function of pressure instead of altitude in the bottom right panel. (For interpretation of the references to color in this figure legend, the reader is referred to the web version of this article.)

