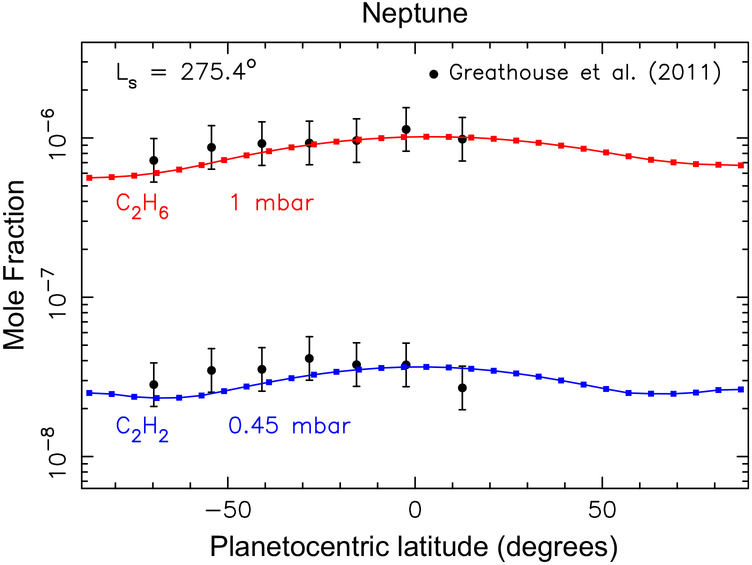
Figure 19:
Model predictions for the meridional variation of the ethane mixing ratio at 1 mbar (red curve) and the acetylene mixing ratio at 0.45 mbar (blue curve) at Ls = 280°, in comparison with the retrievals of Greathouse et al. (2011) from Gemini/TEXES observations at Ls = 275.4°.

