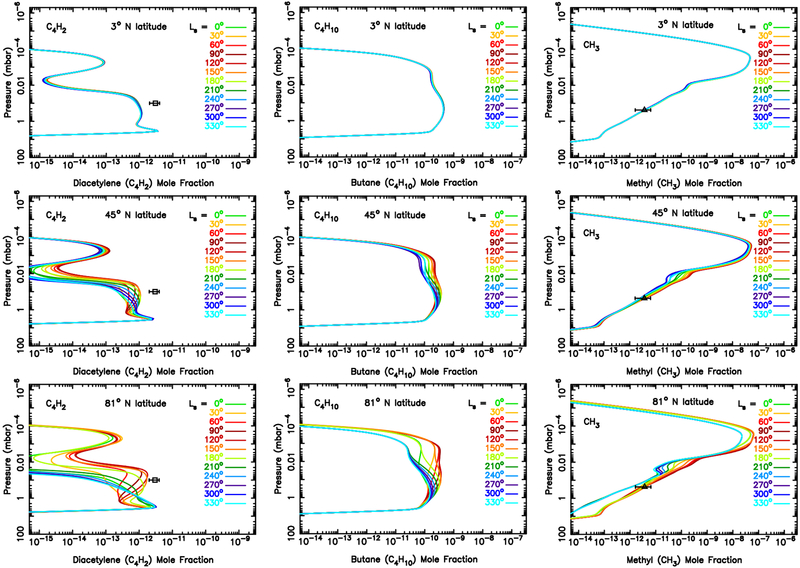
Figure 5:
Mixing ratio profiles for key hydrocarbons (as labeled) on Neptune as a function of season for 3°N planetocentric latitude (Top), 45° planetocentric latitude (Middle), and 81° planetocentric latitude (Bottom). Seasons are shown every 30° in Ls. Data points are from various published observations (global average or low latitude, acquired during Ls = 230–300°) (Caldwell et al., 1988; Bézard et al., 1991; Bishop et al., 1992; Orton et al., 1992; Kostiuk et al., 1992; Yelle et al., 1993; Bézard et al., 1998; Schulz et al., 1999; Meadows et al., 2008; Fletcher et al., 2010; Greathouse et al., 2011; Lellouch et al., 2015), and unpublished Infrared Space Observatory hydrocarbon observations (Bruno Bézard, personal communication, 2001).


