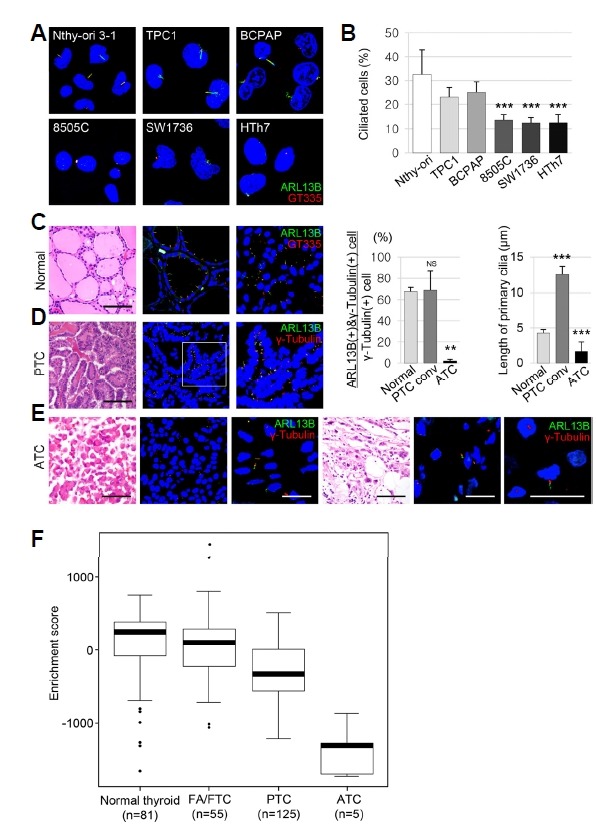
Fig. 1. The expression of primary cilia is decreased in anaplastic thyroid carcinomas (ATCs).

(A) Immunofluorescence (IF) analysis of primary cilia using ARL13B (green) for axonemes and GT335 (red) for axonemes with basal bodies. (B) The frequency of primary cilia was 32.60 ± 10.20% in Nthy-ori 3-1, 23.13 ± 3.74% in TPC1, 25.13 ± 4.25% in BCPAP, 12.28 ± 5.63% in 8505C, 12.46 ± 2.38% in SW1736, and 12.52 ± 3.23% in HTh7 cells, respectively. (C, D, E) IF analysis of primary cilia using ARL13B (green) for axonemes and γ-tubulin (red) for basal bodies. The frequency of primary cilia was 67.53 ± 3.62% in normal thyroid follicles, 68.74 ± 18.01% in PTC, and 1.87 ± 1.51% in ATC (normal vs. PTC, P = 0.2956; normal vs. ATC, P < 0.001). **P < 0.01; ***P < 0.001; NS, not significant. Scale bar: H&E, 100 μm; IF, 5 μm. (F) Activation of primary cilia-specific genes in the normal thyroid and thyroid cancers. Boxplots from the single sample gene set enrichment analysis (ssGSEA) show the activation levels of primary cilia-specific genes in the normal thyroid and in three subtypes of thyroid cancer. Abbreviations: FA/FTC, follicular adenoma/follicular thyroid carcinoma; PTC, papillary thyroid carcinoma; ATC, anaplastic thyroid carcinoma.
