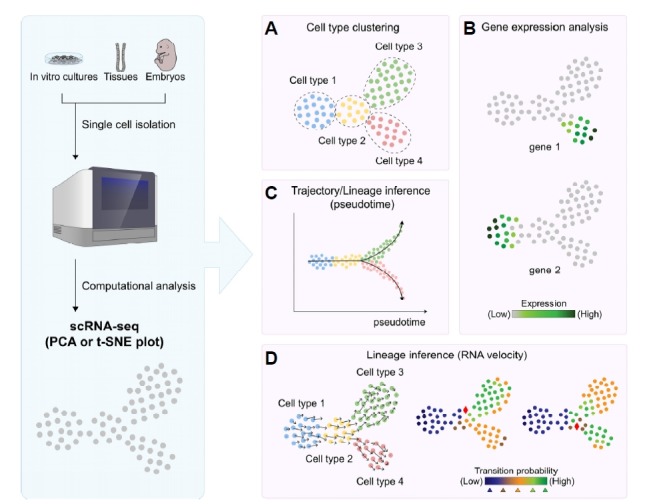
Fig. 1. Analysis of cell populations using single-cell RNA-sequencing.

Individual cells isolated from cell culture, embryos or tissues are subjected to scRNA-seq to profile gene expression. Analysis of scRNA-seq results using principal component analysis (PCA) or t-distributed stochastic neighbor embedding (t-SNE) allows the clustering of (sub)populations of cells and identification of cell types (A). The same plot can be used to visualize gene expression levels on a color scale to assess cell type-specific transcripts (B). To investigate the transition between different cell types in a biological context, pseudotime trajectory inference algorithms allow the mapping of transitions on an arbitrary time scale (C). Another lineage inference method, called RNA velocity, calculates the proportion of unspliced and spliced transcripts, thereby allowing prediction of the prospective fate of individual cells (D).
