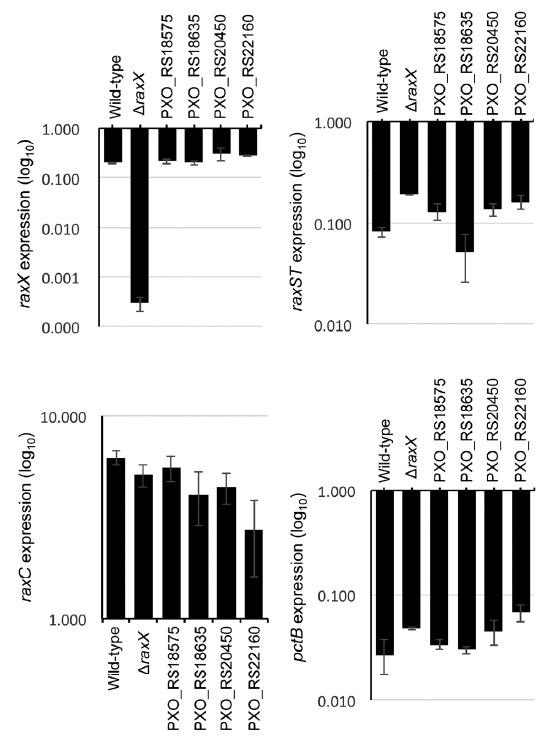
Fig. 3. Gene expression analysis of rax genes in mutant strains for candidate rax regulators.

The transcript levels of raxX, raxST, raxC, and pctB were analyzed in the indicated strains that were grown in PSB by qRT-PCR. Data shown here is normalized to the PXO99. Bars depict average expression level ± S.D of three technical replicates. This experiment was repeated at least twice with similar results.
