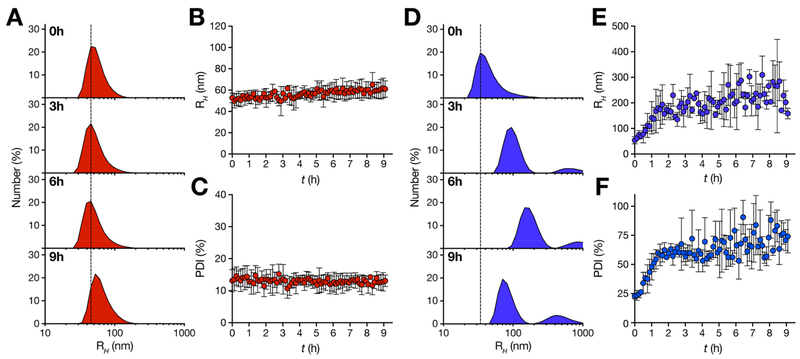
Figure 2.
HRC5 and HRC6 NP time-dependent size distributions. Time-resolved DLS measurements of HRC5 (A−C) and HRC6 (D−F) NP. Number-averaged size distribution profiles (A and D) of each sample (30 μM), collected for a 9 h period (0, 3, 6, and 9 h profiles are presented), were used to determine the respective average RH (B and E) and sample PDI (C and F) values, plotted for each time point. The dashed line is a guide to the eye. RH and PDI data sets are the average of three independent replicates. Error bars correspond to the standard deviation of the mean.

