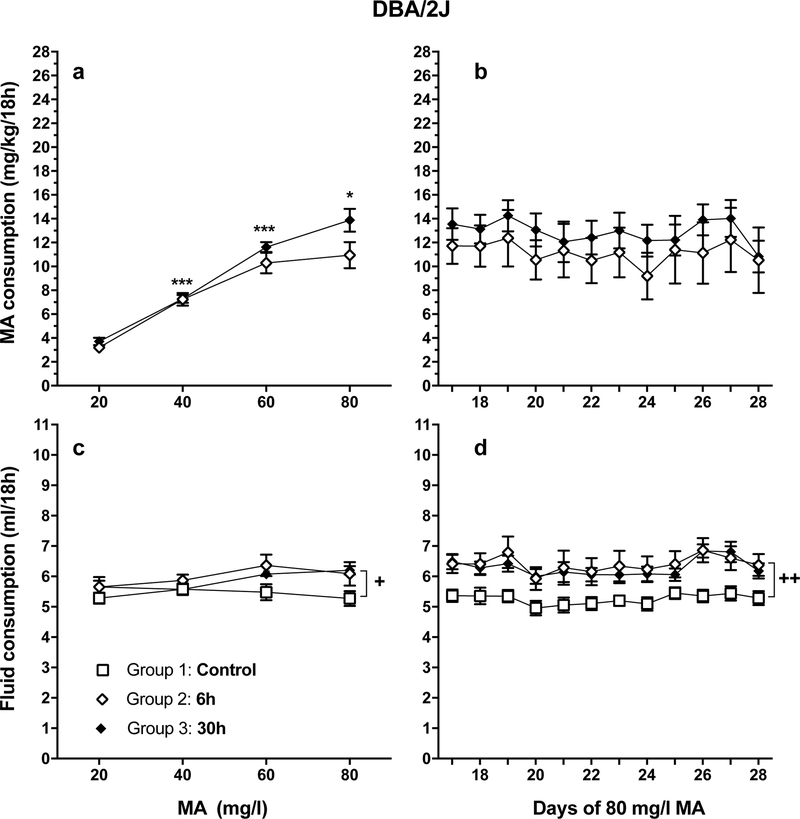
Figure 3.
MA and fluid intake data for experiment 2. See Figure 1A for the experimental design. With increasing MA concentration, DBA/2J (D2) mice increase their MA consumption and sustain high levels of intake for another 12 days, though at a level about half that of MAHDR mice (see Figure 1). a: mean (± SEM) mg/kg/18h MA consumed for MA concentrations offered for 4 days each; b: mean (± SEM) mg/kg/18h MA consumed when access to 80 mg/l MA was extended for an additional 12 days. cand d: mean (± SEM) total fluid consumed during the periods in a and b. n = 8/group/sex. *p<.05, ***p<.001, compared to the next lower MA concentration for Group 2 and 3 data; +p<.05, ++p<.01 for the comparison of each MA group (Groups 2 and 3) to the control group (Group 1).

